Express - Elastic Search - Monitoring 3
(we are using the elk open source 15.x.x) Once we've created all the files it's time to run the application and see what happens First thing we do, start the docker program on your computer and in the command prompt of our project type `docker compose up`
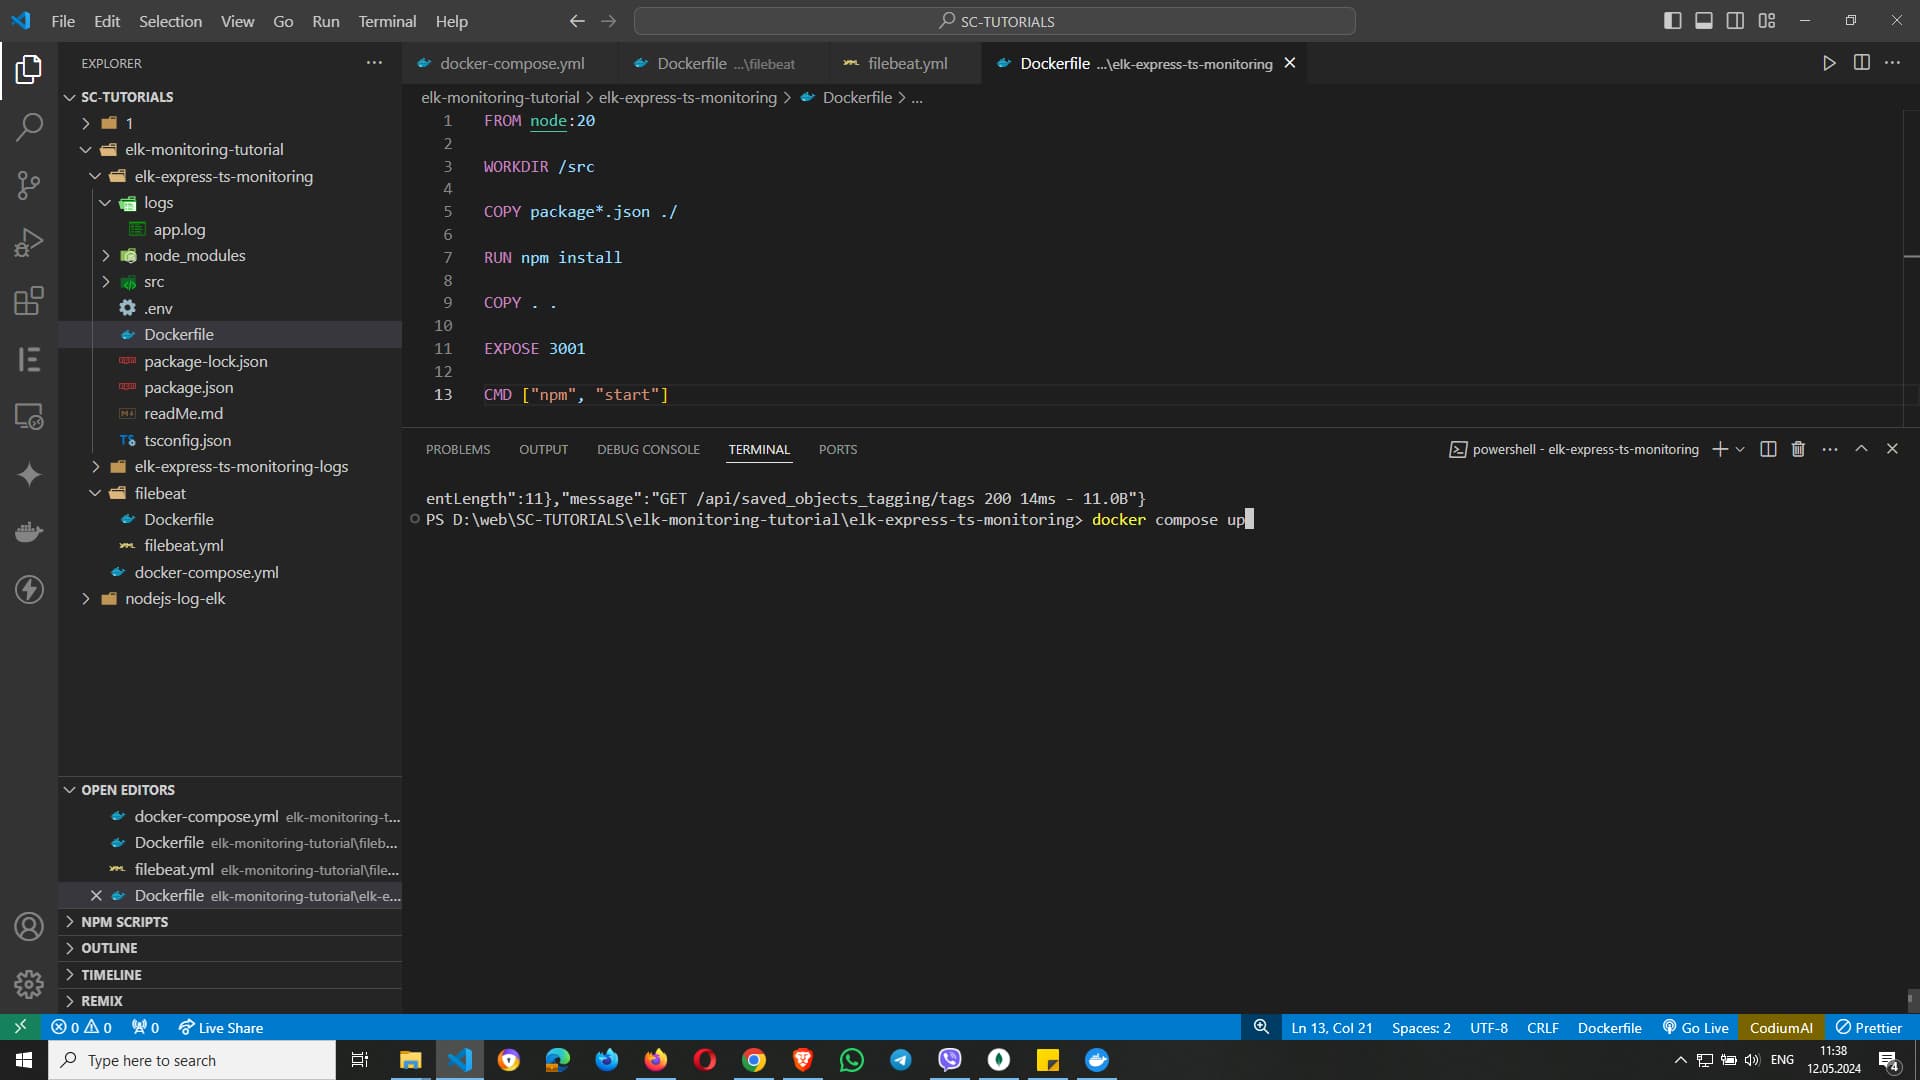
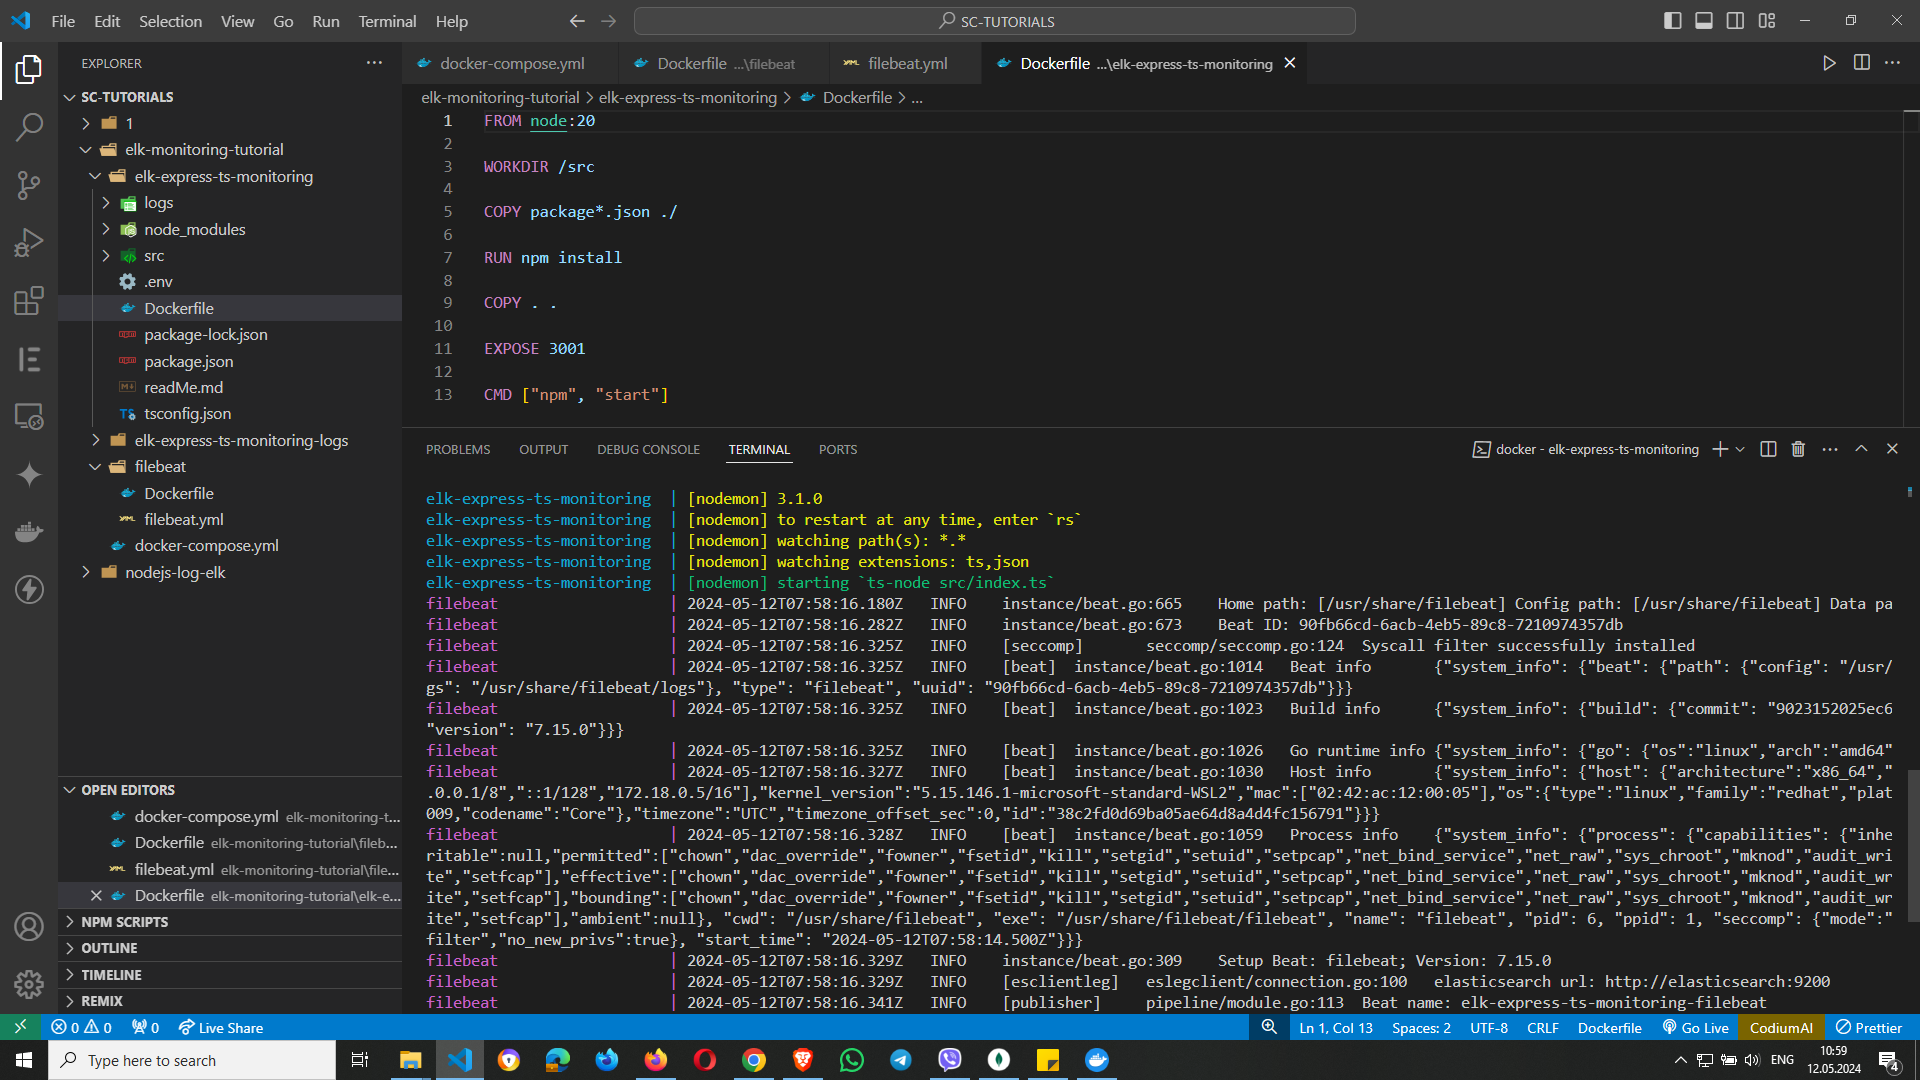
The code in the picture is a Dockerfile, which is used to create a Docker image for a Node.js application. Here's a step-by-step explanation of the code:
FROM node:20This line specifies the base image for the Docker container, which is Node.js version 20.
WORKDIR /srcThis sets the working directory inside the container to /app.
COPY package*.json ./This copies the package.json and package-lock.json files from the host machine to the working directory in the container.
RUN npm installThis runs the npm install command to install the dependencies specified in the package.json file.
COPY . .This copies all the files from the host machine to the working directory in the container.
EXPOSE 3001This tells Docker to expose port 3001 on the container. This is the port the Node.js application will use.
CMD ["npm", "start"]This specifies the command to run when the container starts. It runs npm start, which typically starts the Node.js application.
The terminal shows the command docker compose up being run, which starts all the services defined in a docker-compose.yml file, bringing up the entire environment.
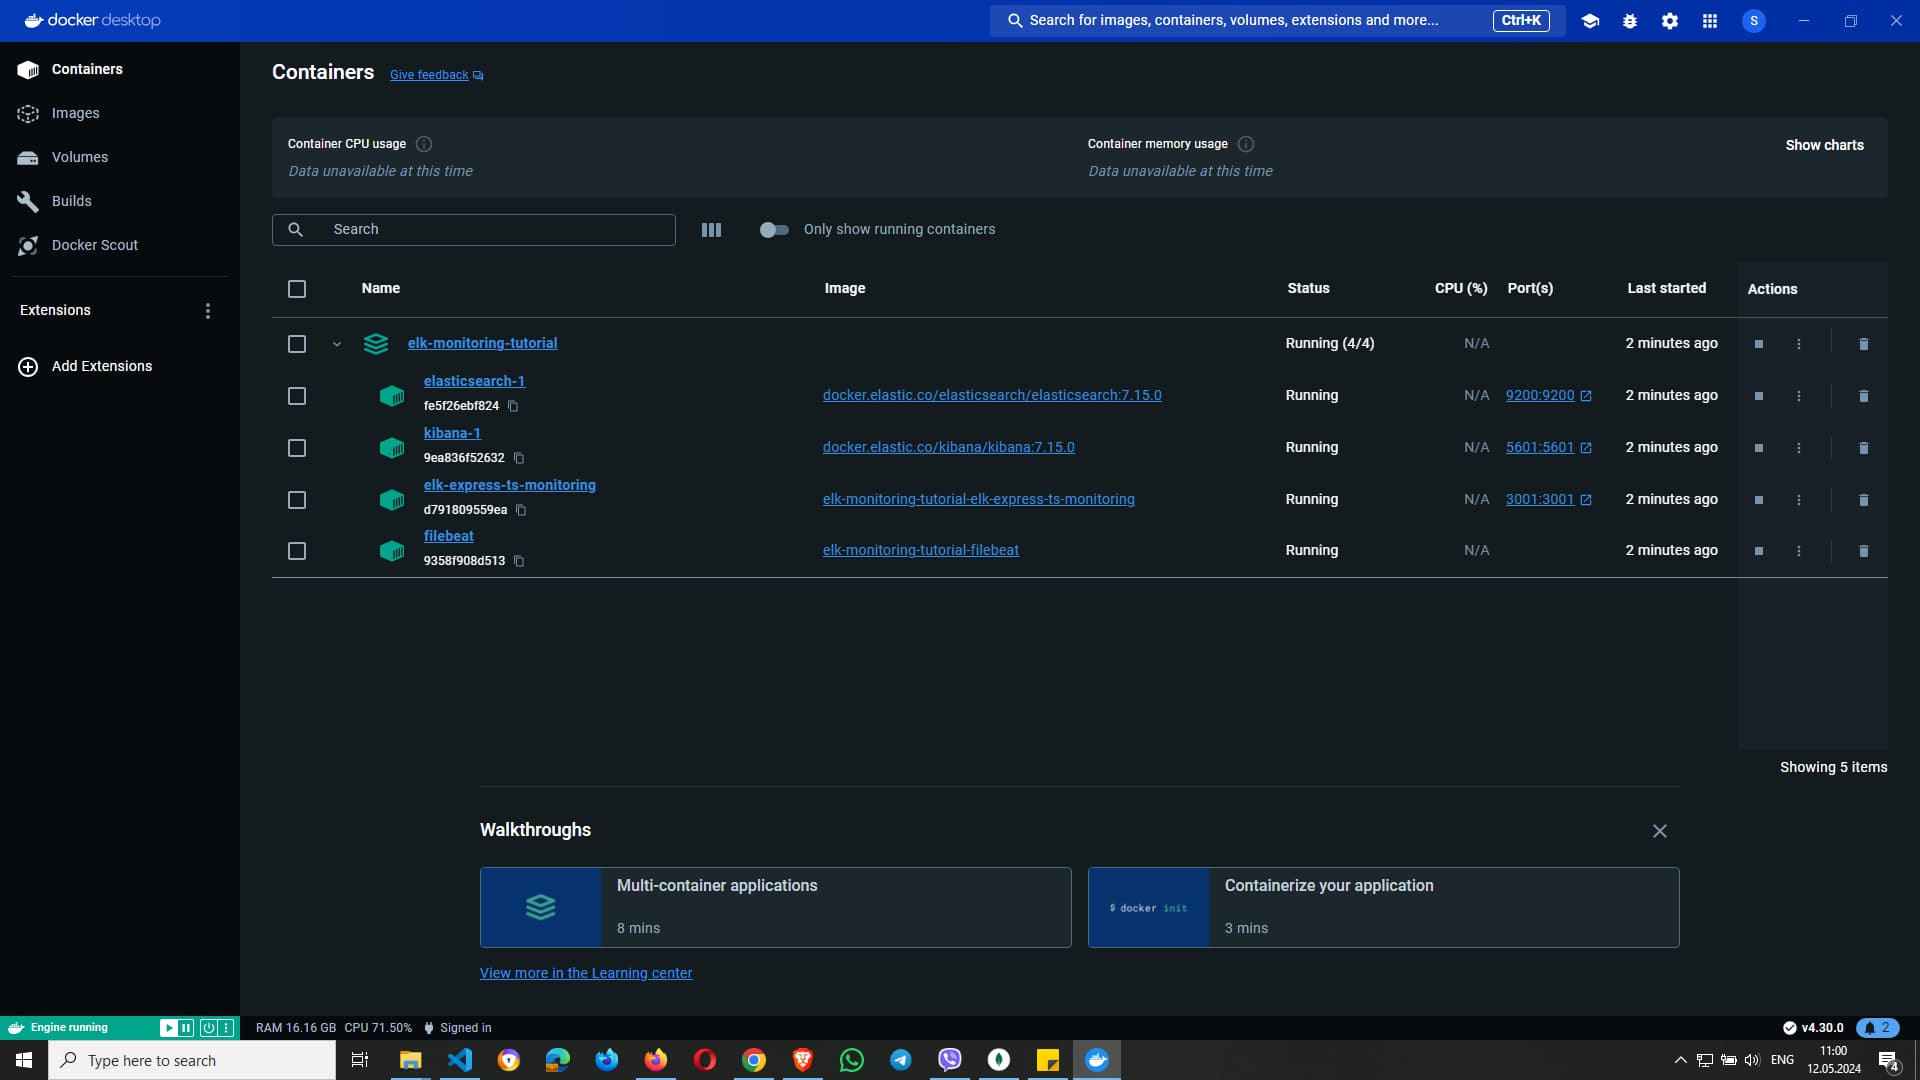
On the pic we see Docker Desktop, which is used to manage Docker containers.
The container list includes several containers, each with information about its name, image, status, CPU and memory usage, ports, and last started time. Containers listed include: elk-monitoring-tutorial, elasticsearch-1, kibana-1, elk-express-ts-monitoring, filebeat
If we click on the 'elasticsearch-1 9200:9200' at the Docker Desktop we should see the pic bellow, but we have to wait a bit.. it is not loading fast..
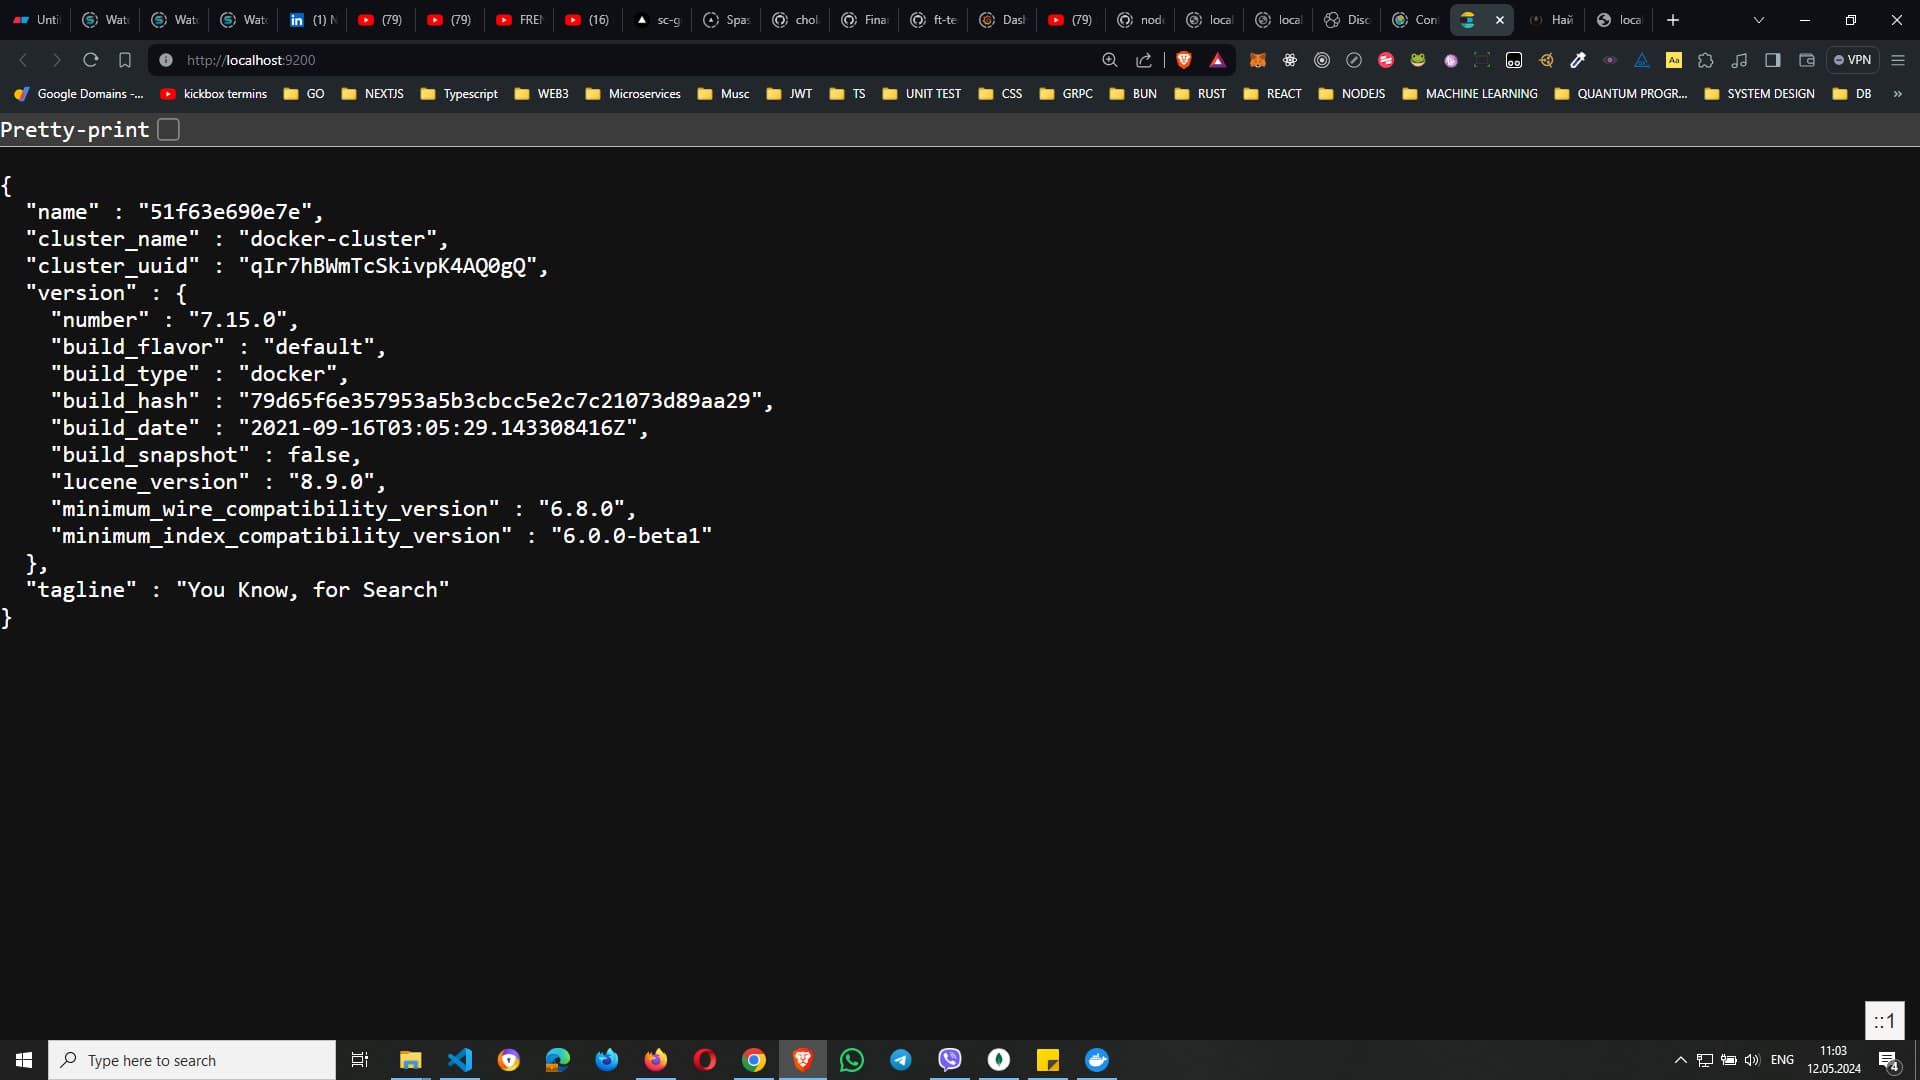
This is a JSON data from an Elasticsearch instance.
By clicking on the 'elk-monitoring-tutorial-elk-express-ts-monitoring 3001:3001' at the Docker Desktop we should see the pic bellow. A simple web page with the text "Hello World!".
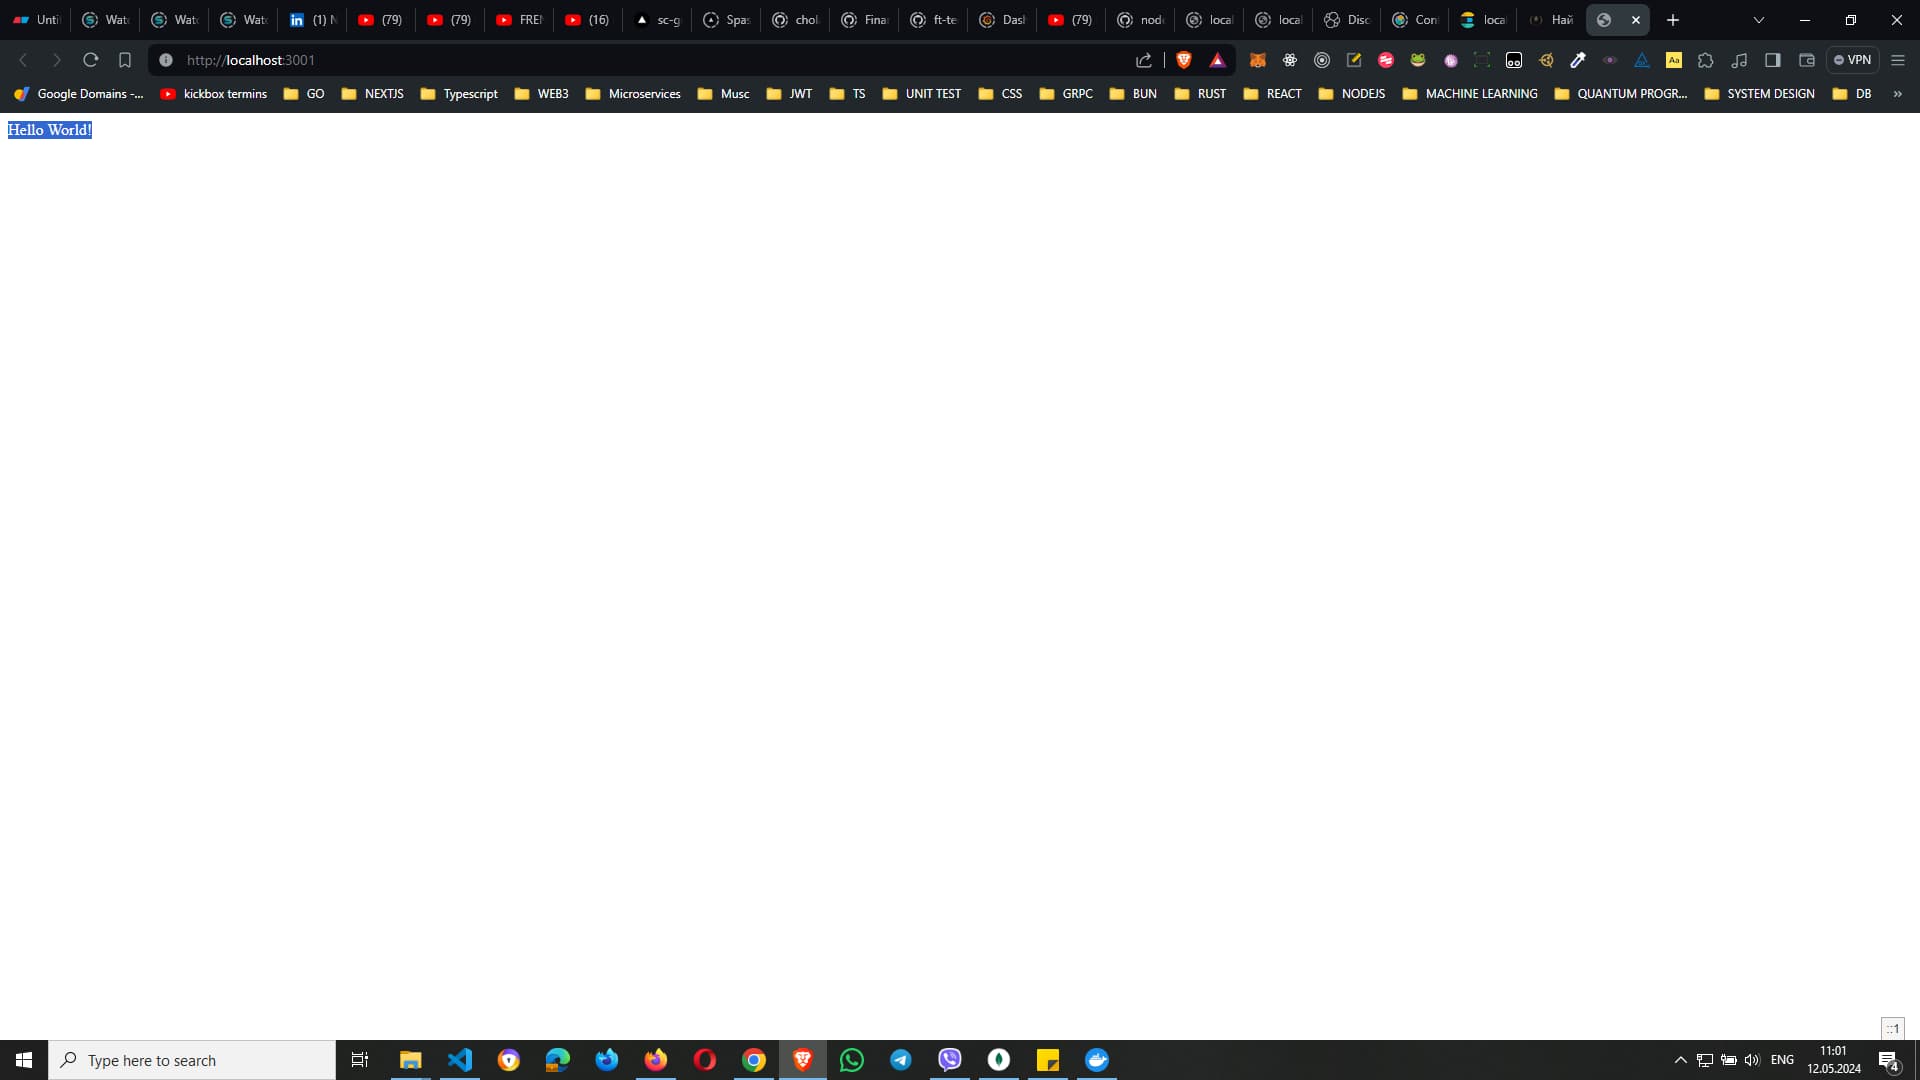
The URL bar at the top shows https://localhost:3001, which indicates that the user is accessing a web server running locally on port 3001.
In the browser address if we type `https://localhost:3001/app/home` we should see the pic bellow:
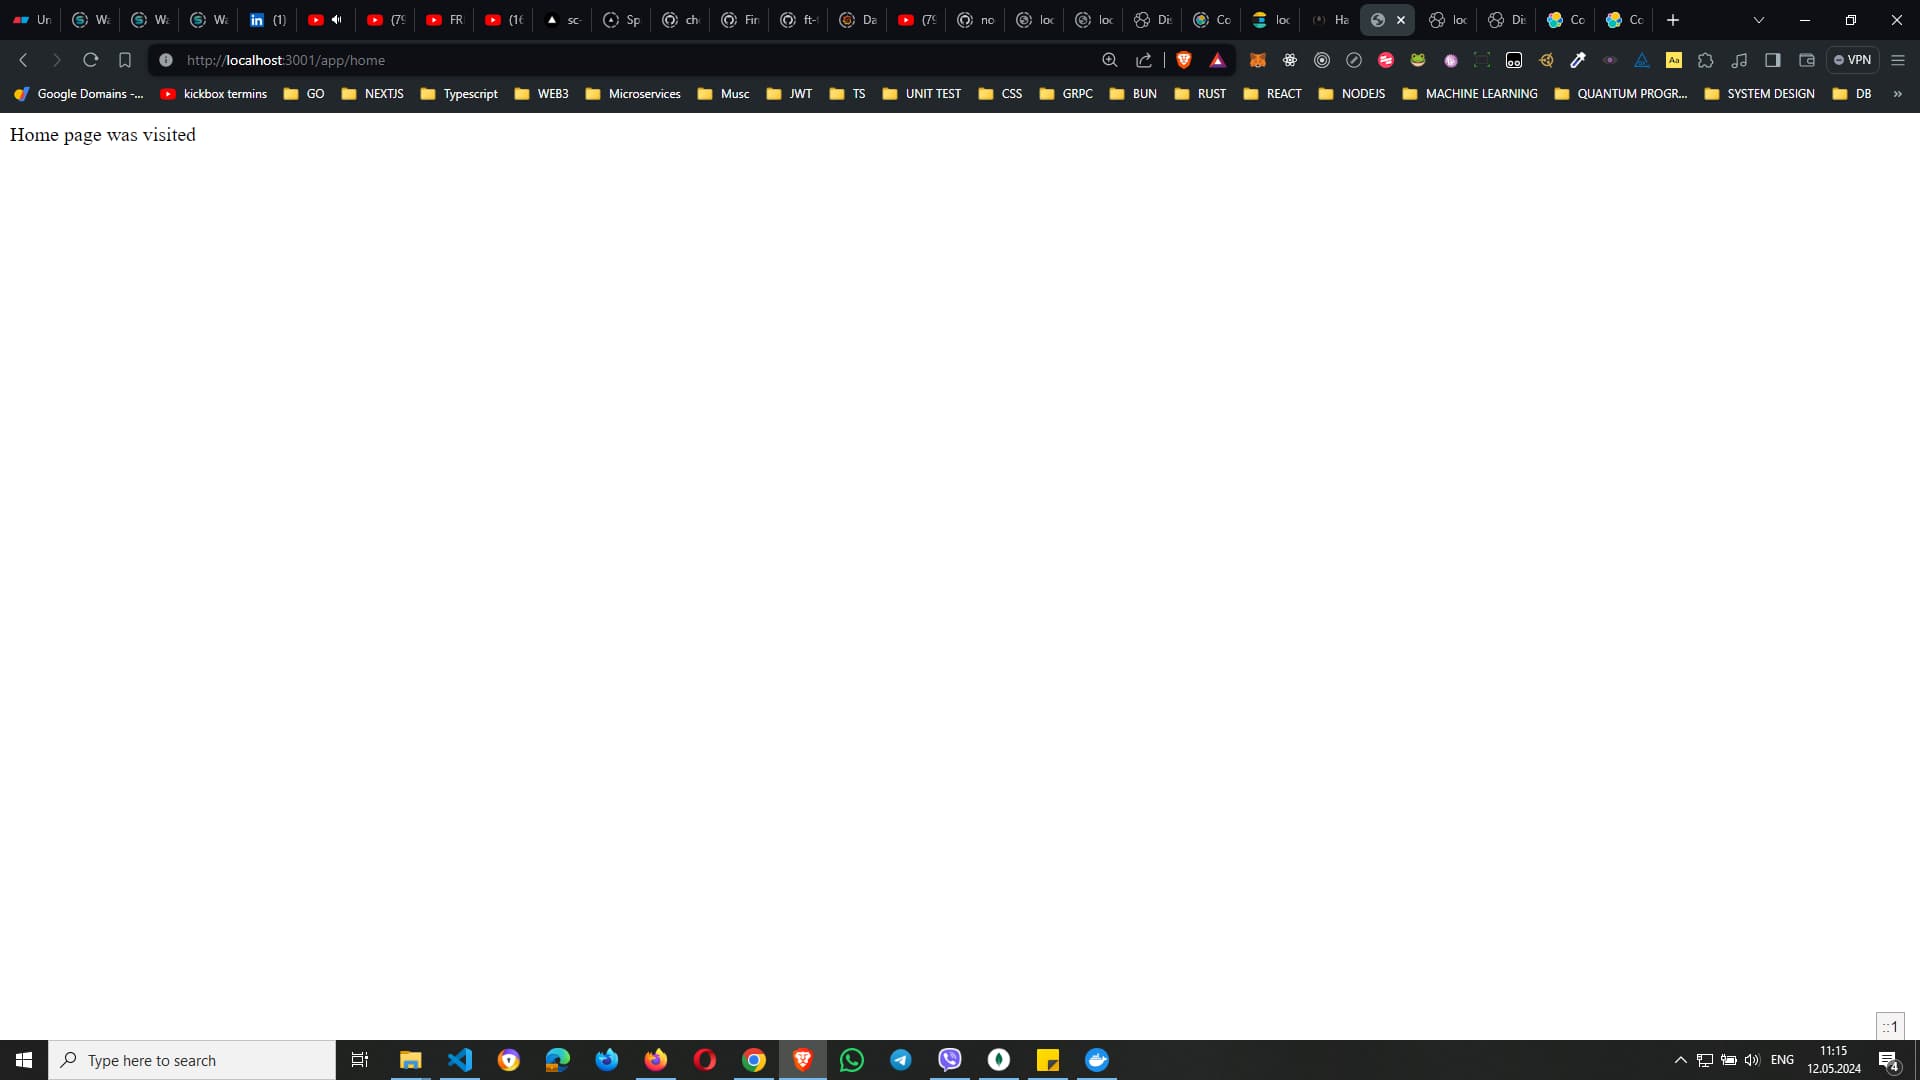
The URL bar at the top shows https://localhost:3001/app/home, indicating that the user is accessing a specific route (/app/home) on a web server running locally on port 3001.
In the browser address if we type `https://localhost:3001/app/about` we should see the pic bellow:
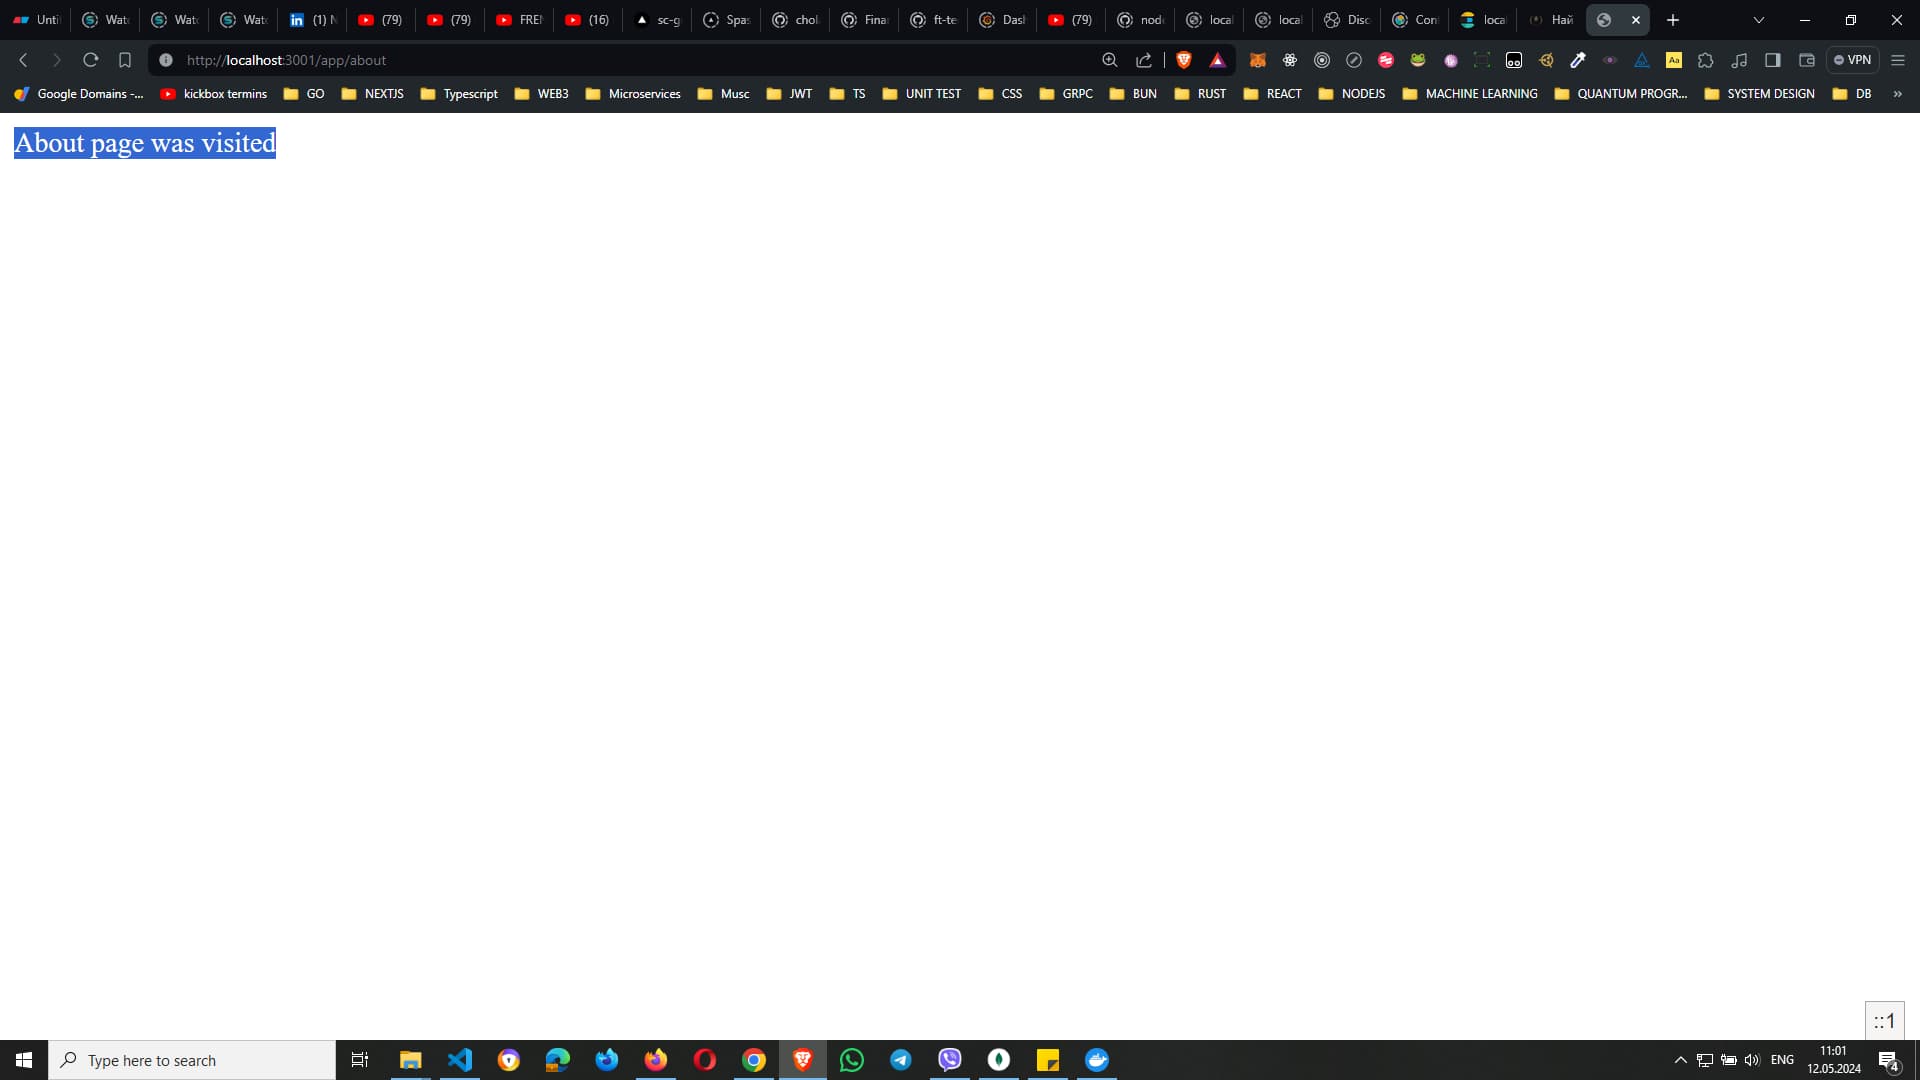
The URL bar at the top shows https://localhost:3001/app/about, indicating that the user is accessing a specific route (/app/about) on a web server running locally on port 3001.
Clicking on Kibana from docker image (https://localhost:5601).. looks like we have to wait a bit...
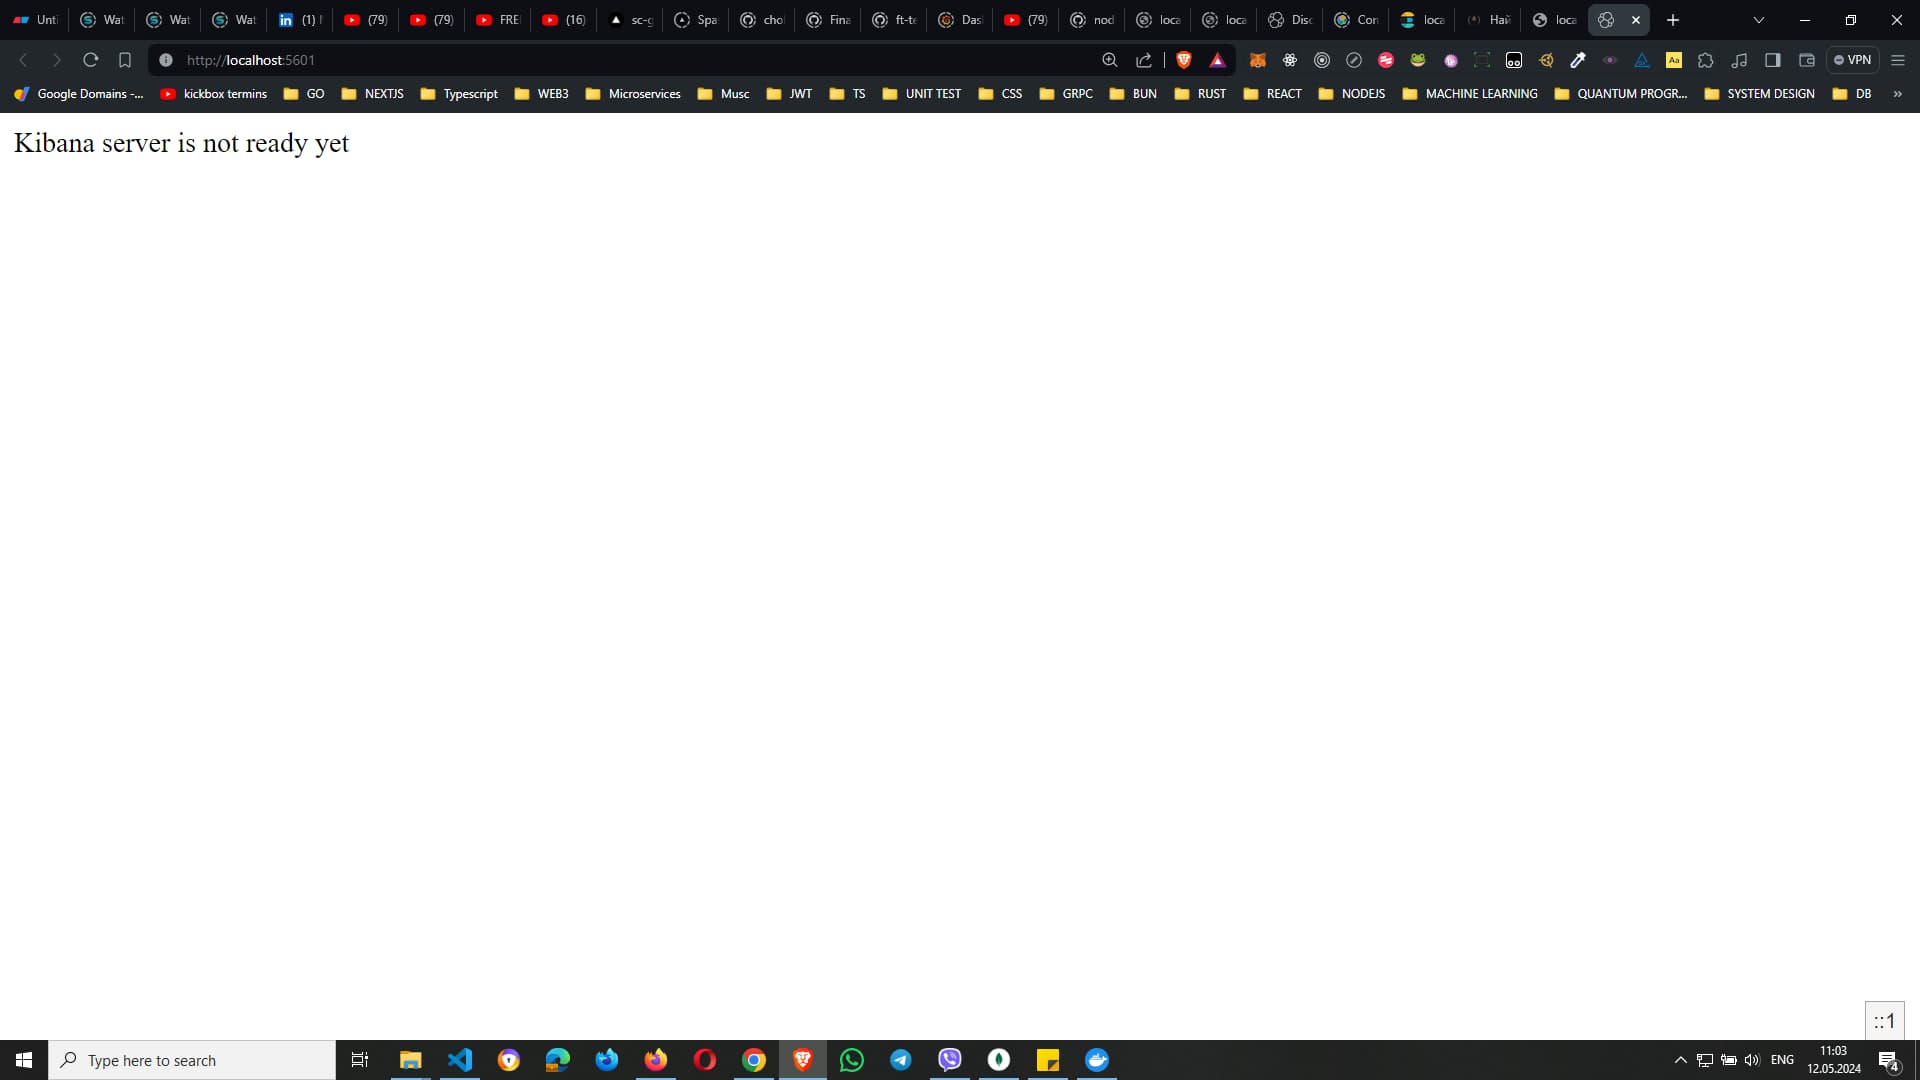
The image is displaying a message from Kibana, a part of the Elastic Stack used for data visualization.
In the browser address if we type `https://localhost:3001/app/blog` we should see the pic bellow:

The URL bar at the top shows https://localhost:3001/app/about, indicating that the user is accessing a specific route (/app/about) on a web server running locally on port 3001.
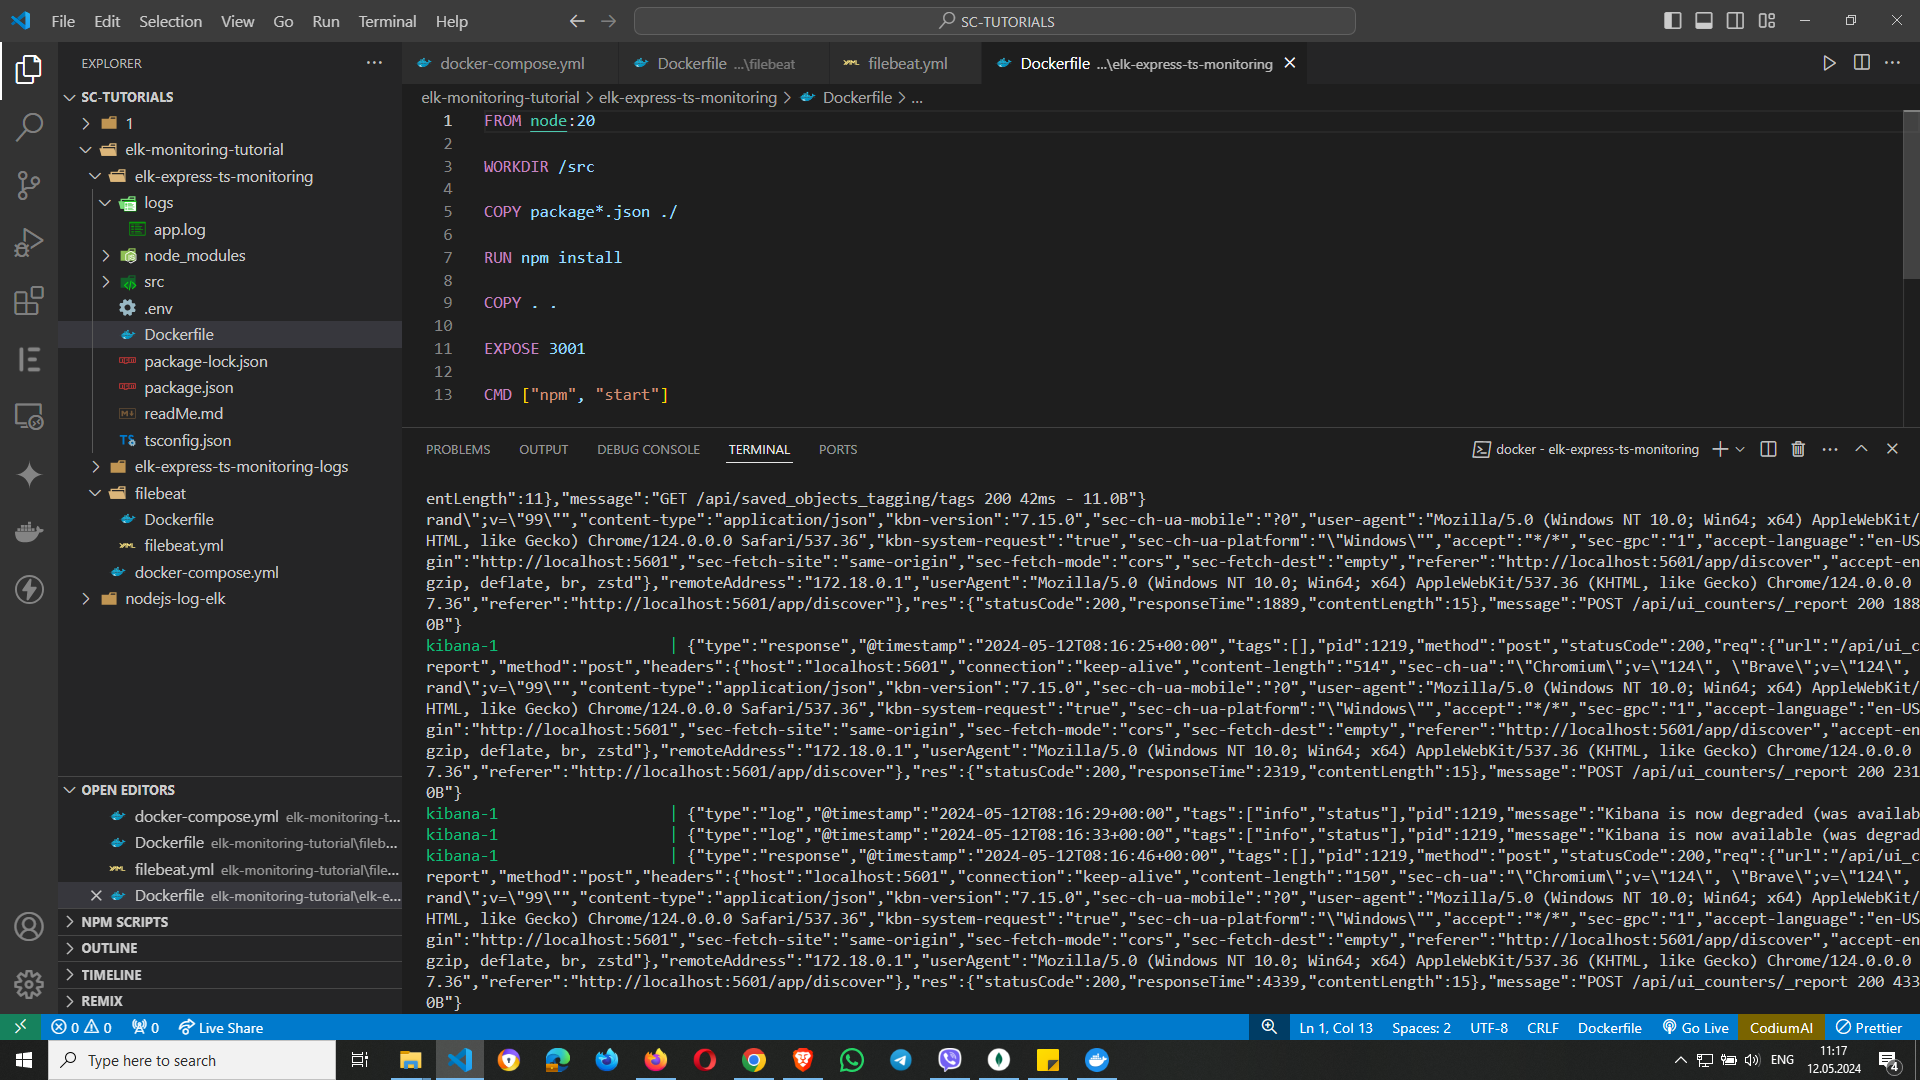
The result in our visual studio after running `docker compose up` in the command prompt, and we checked the apps in the docker, and they are working, so everything works well!
And it is time to start Kibana by clicking in the docker program again on 'kibana-1 5601:5601'
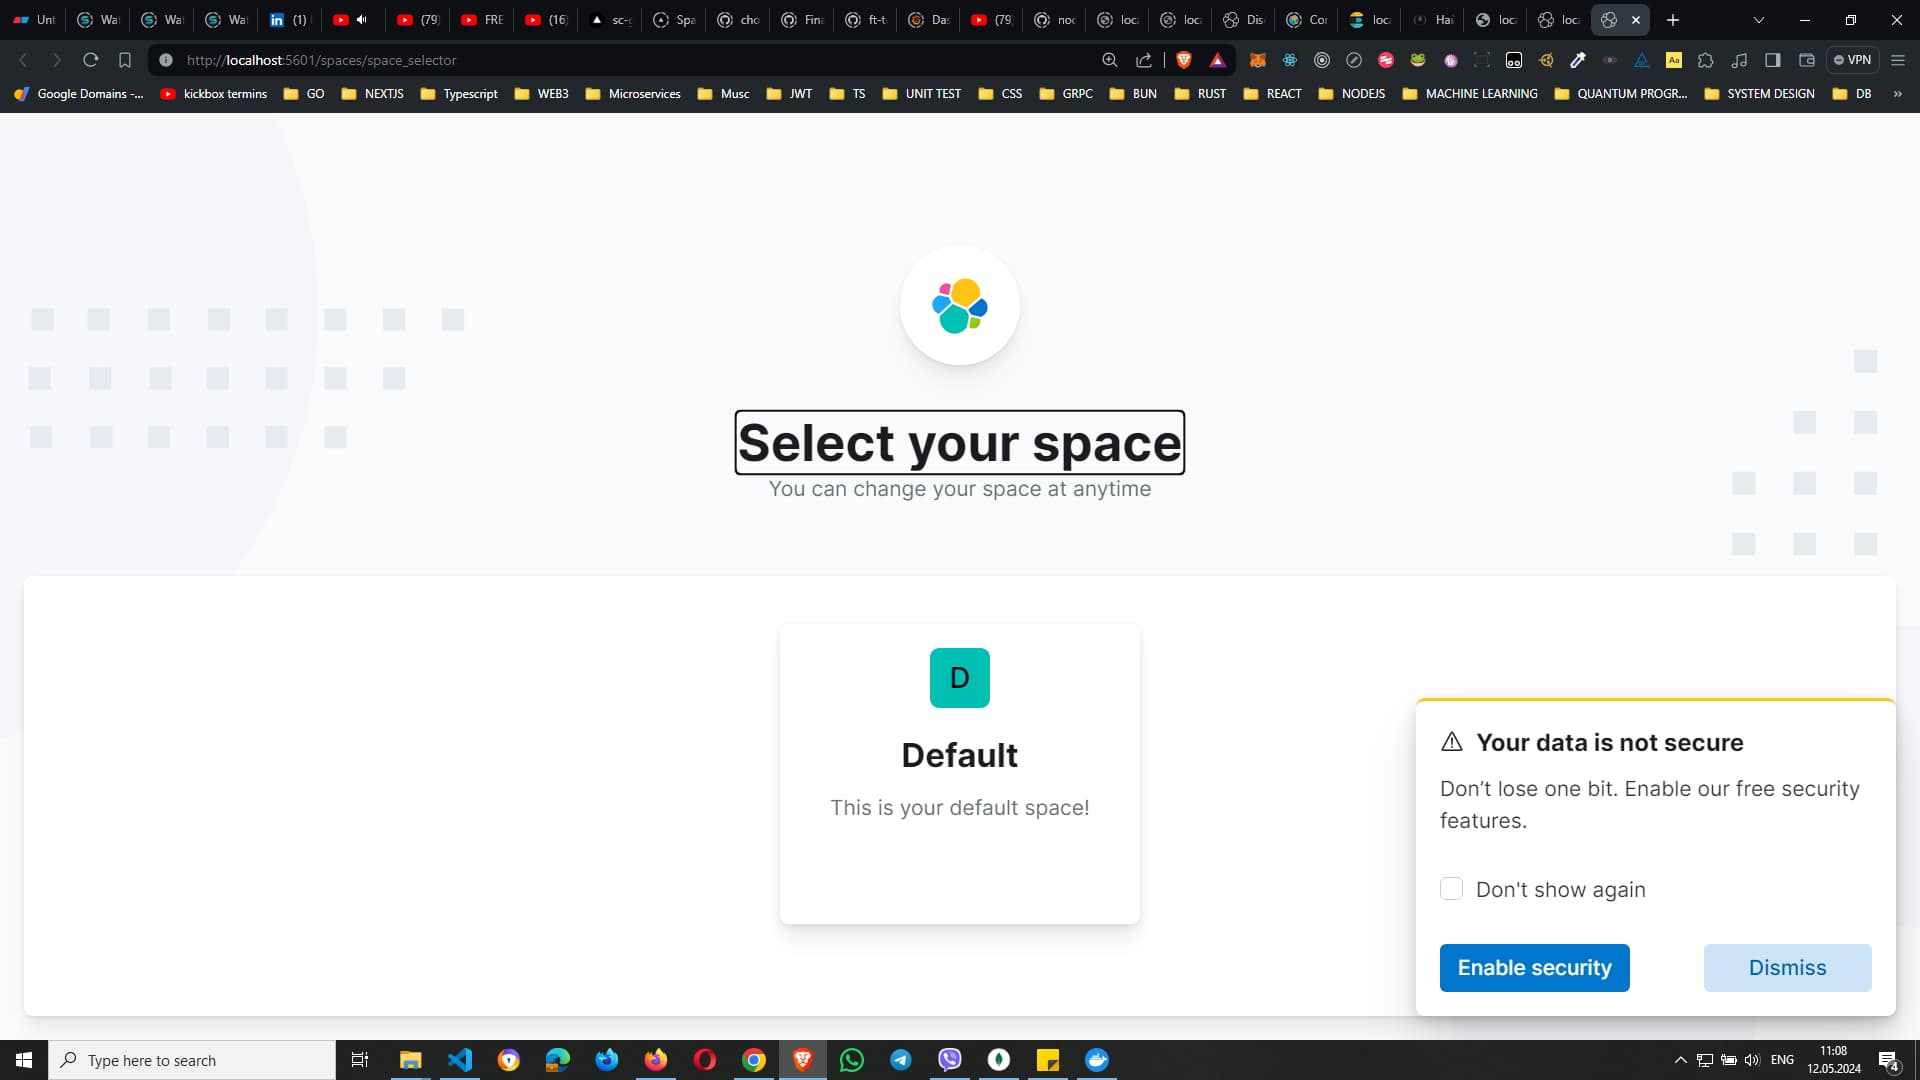
and it works! This time Kibana loaded.. it took some time to load. Our next phase is to make the settings in Kibana so we can monitor our application. Clicking on default block, and our next screen should be the pics bellow:
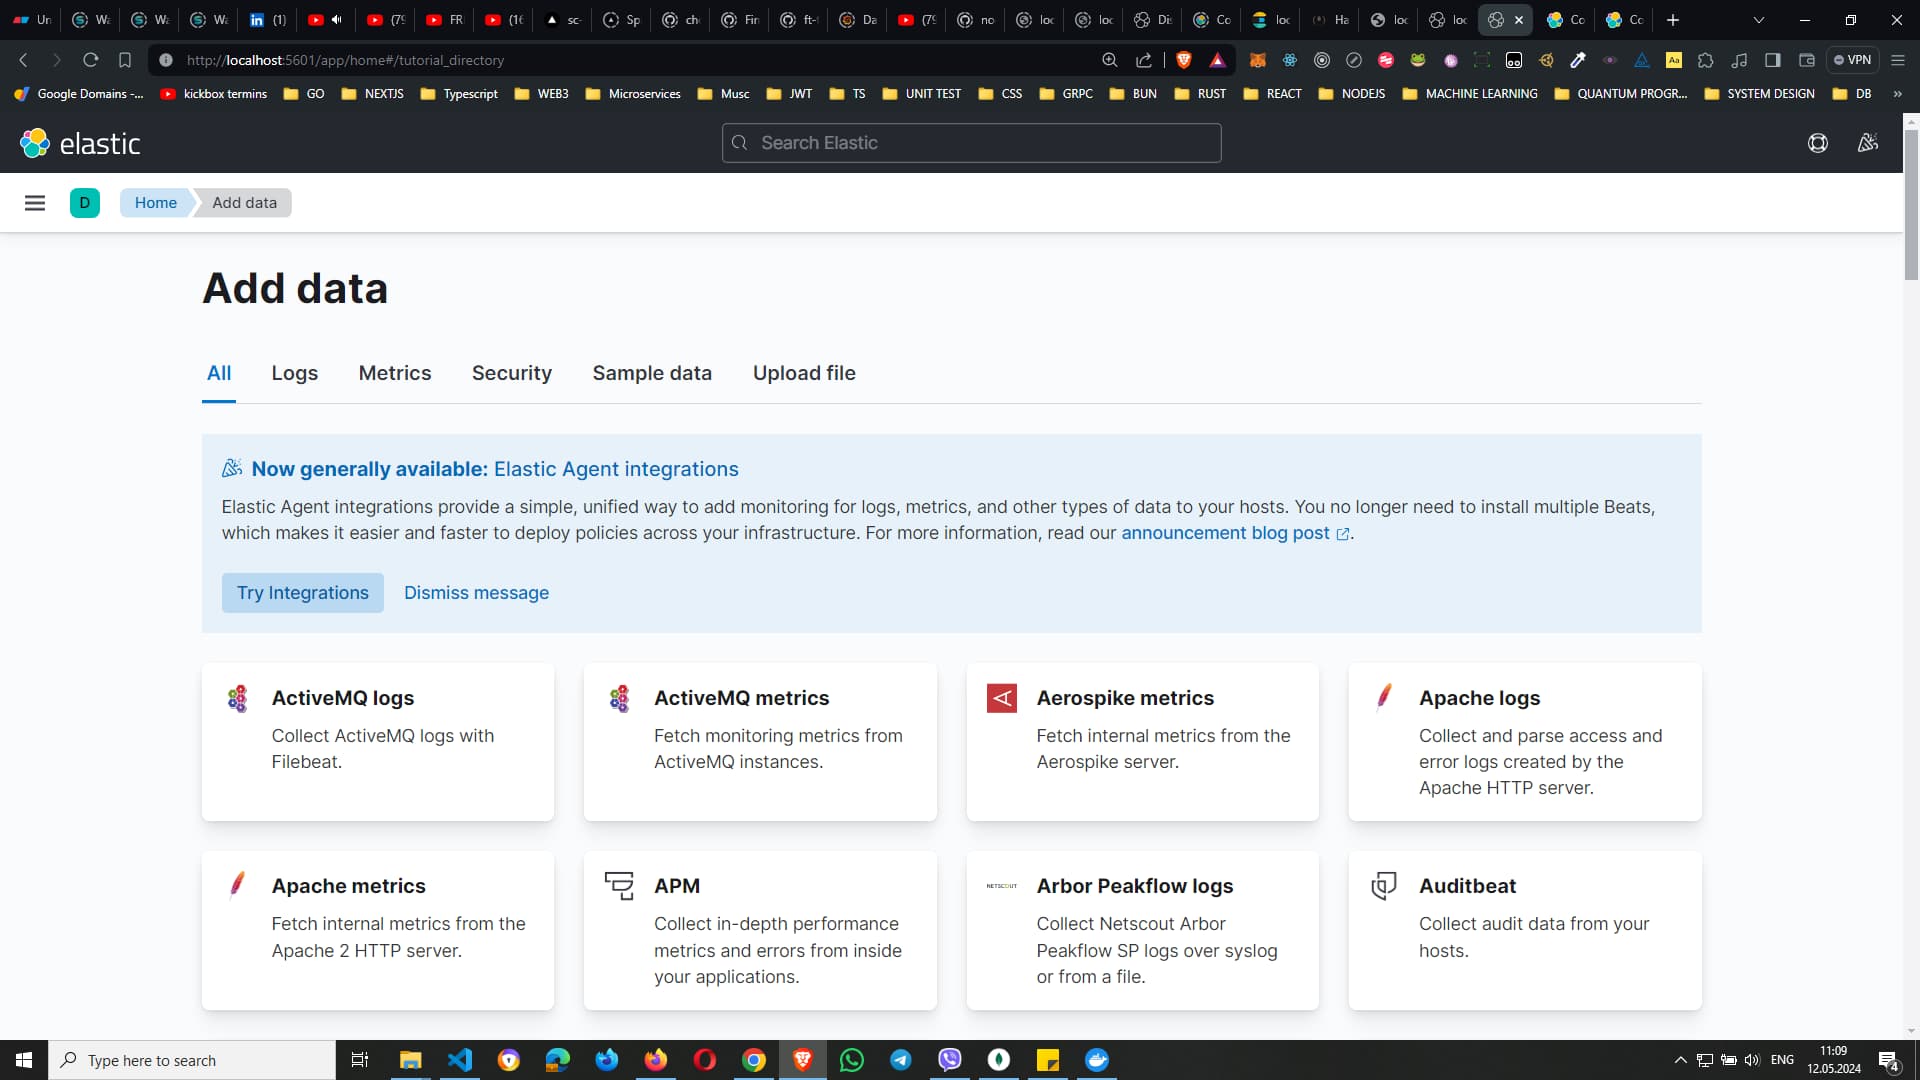
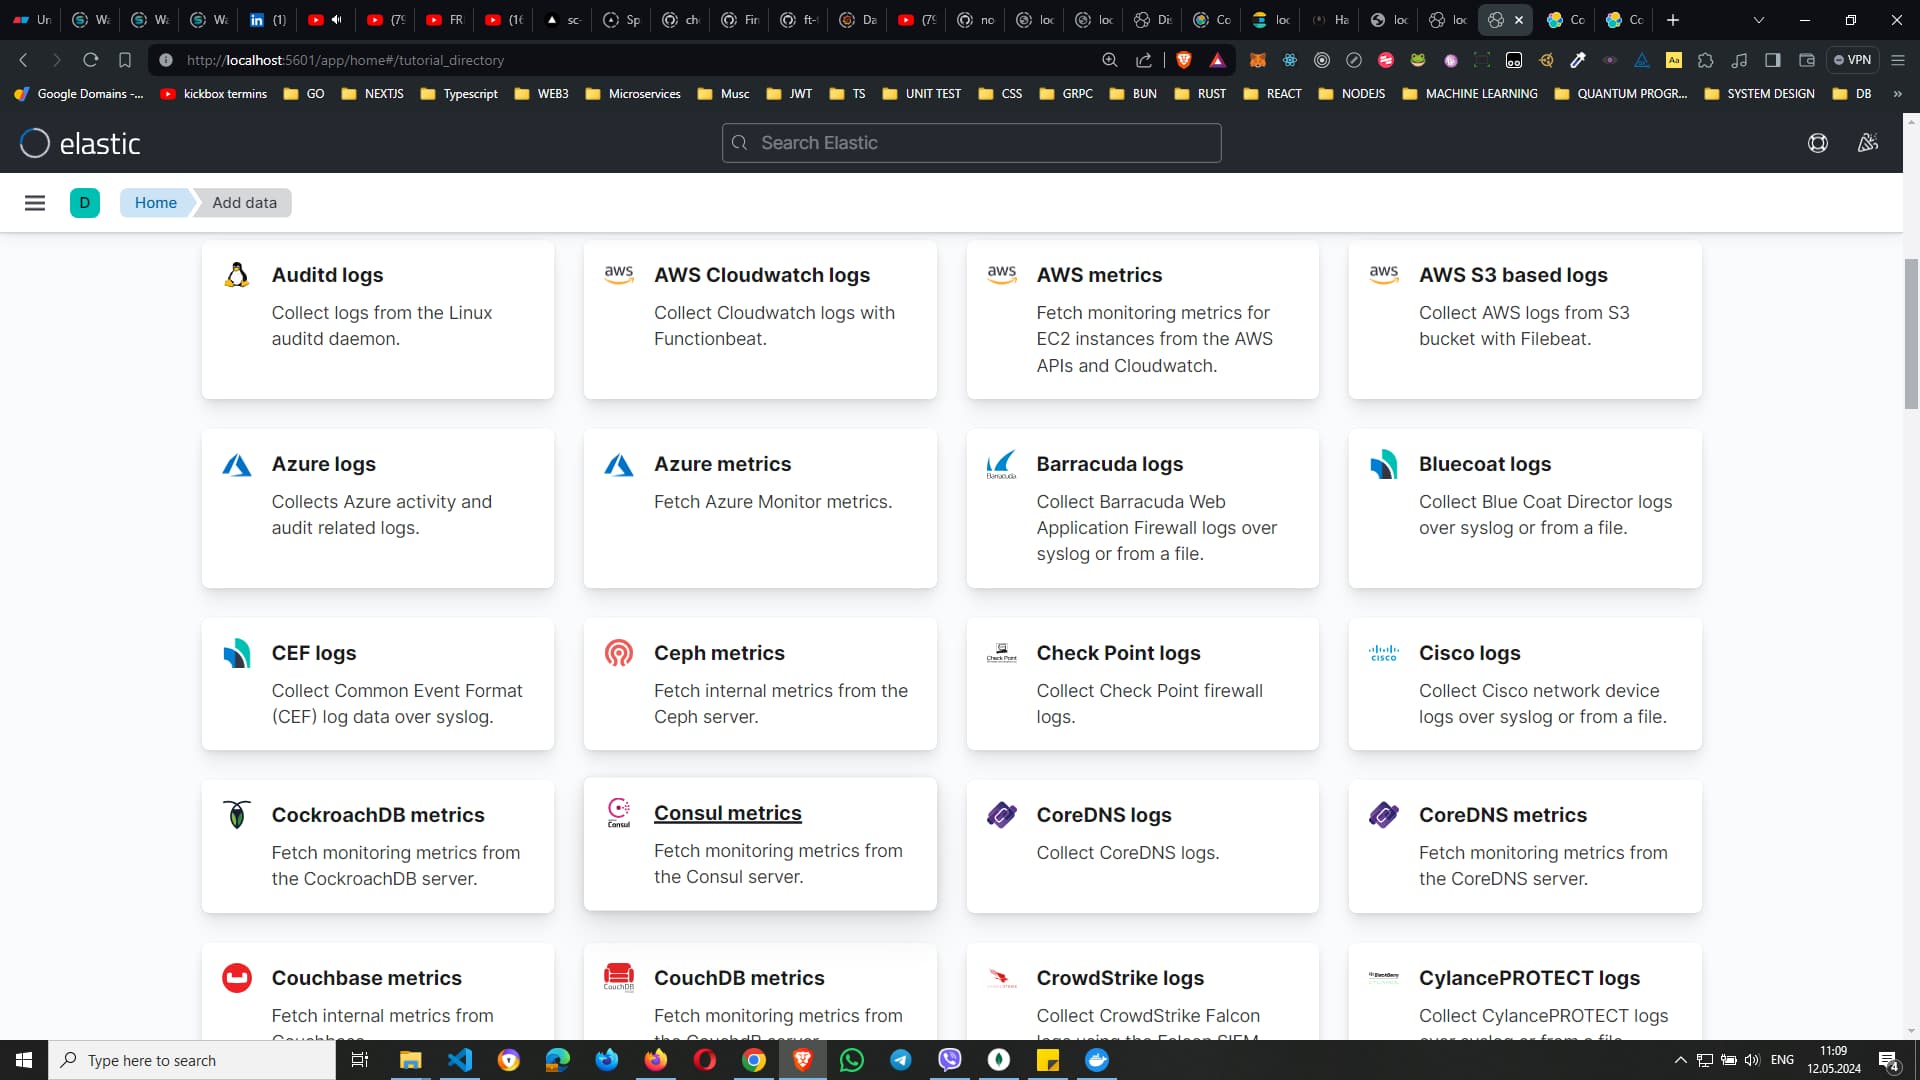
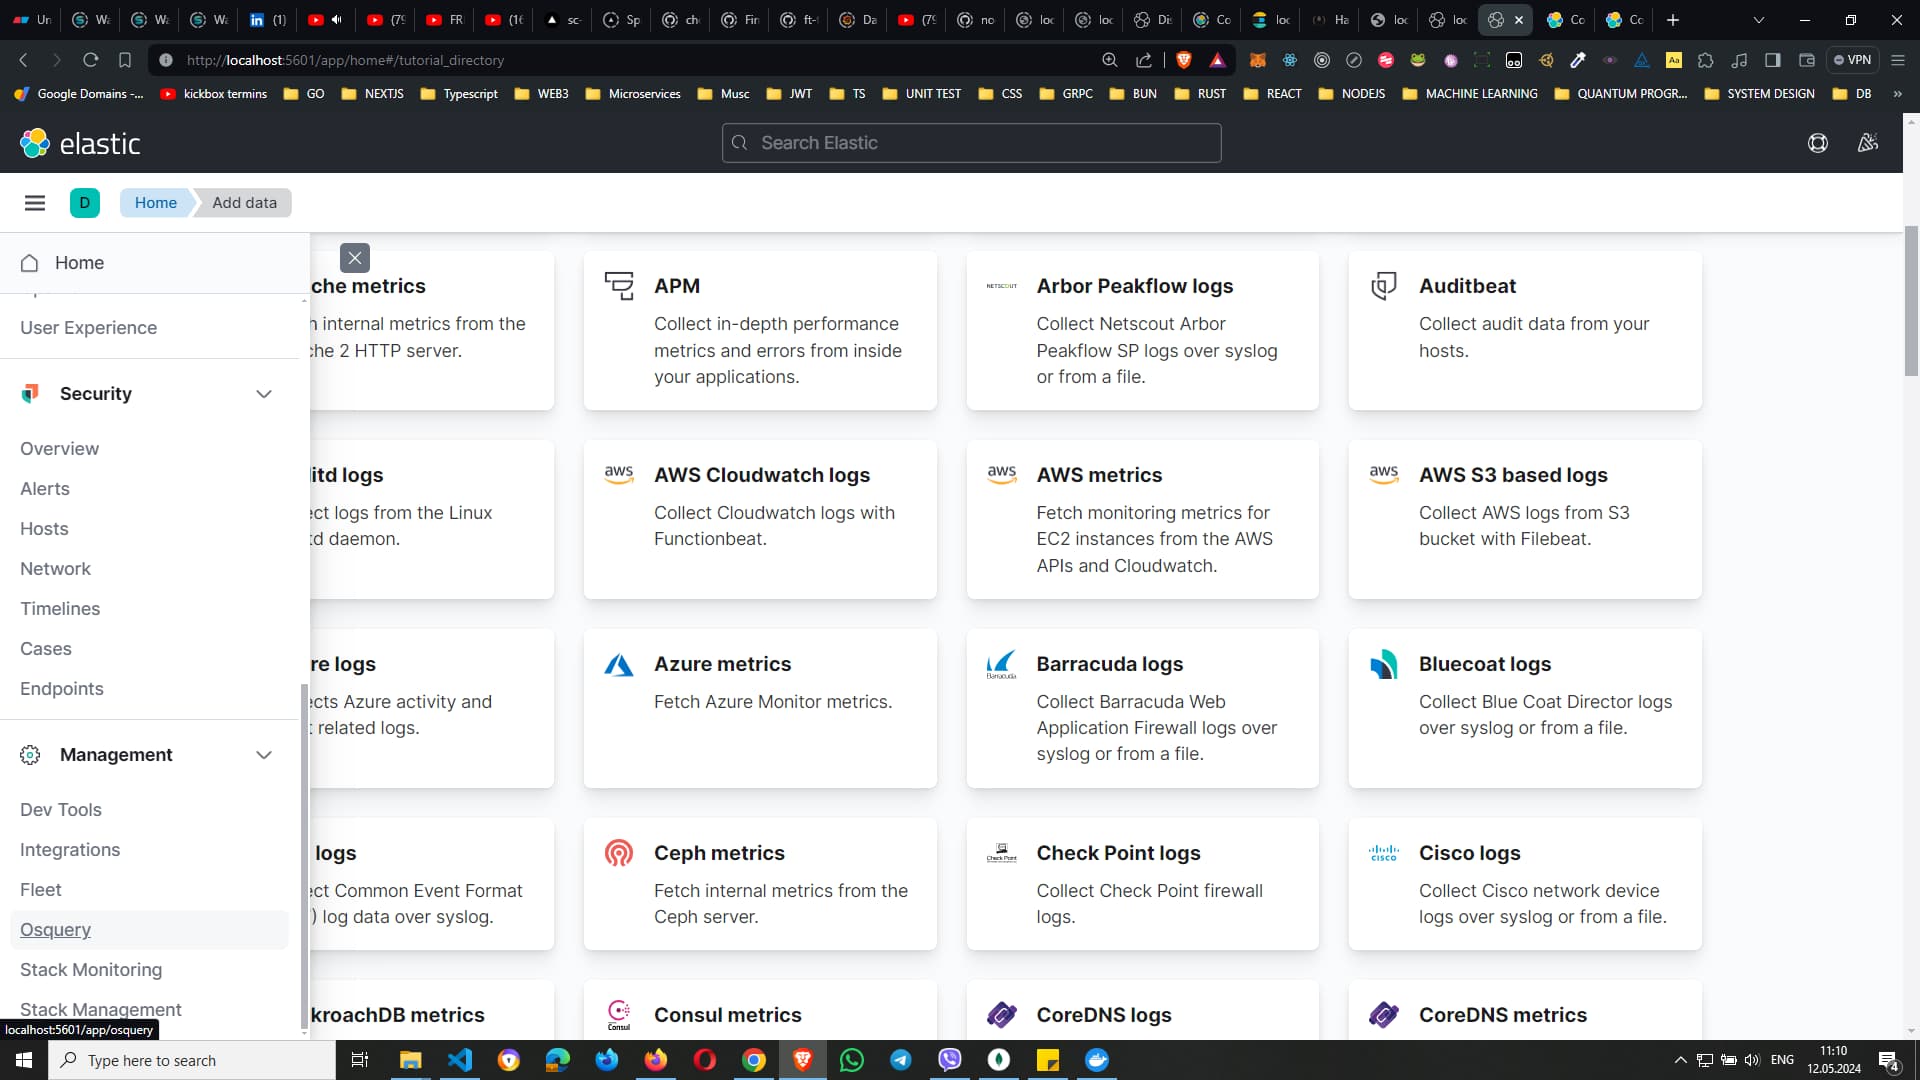
Next step is clicking on the button top left acordion, so we can see the hidden menu, scrolling a bit and then click on the link on the bottom 'Stack Management'
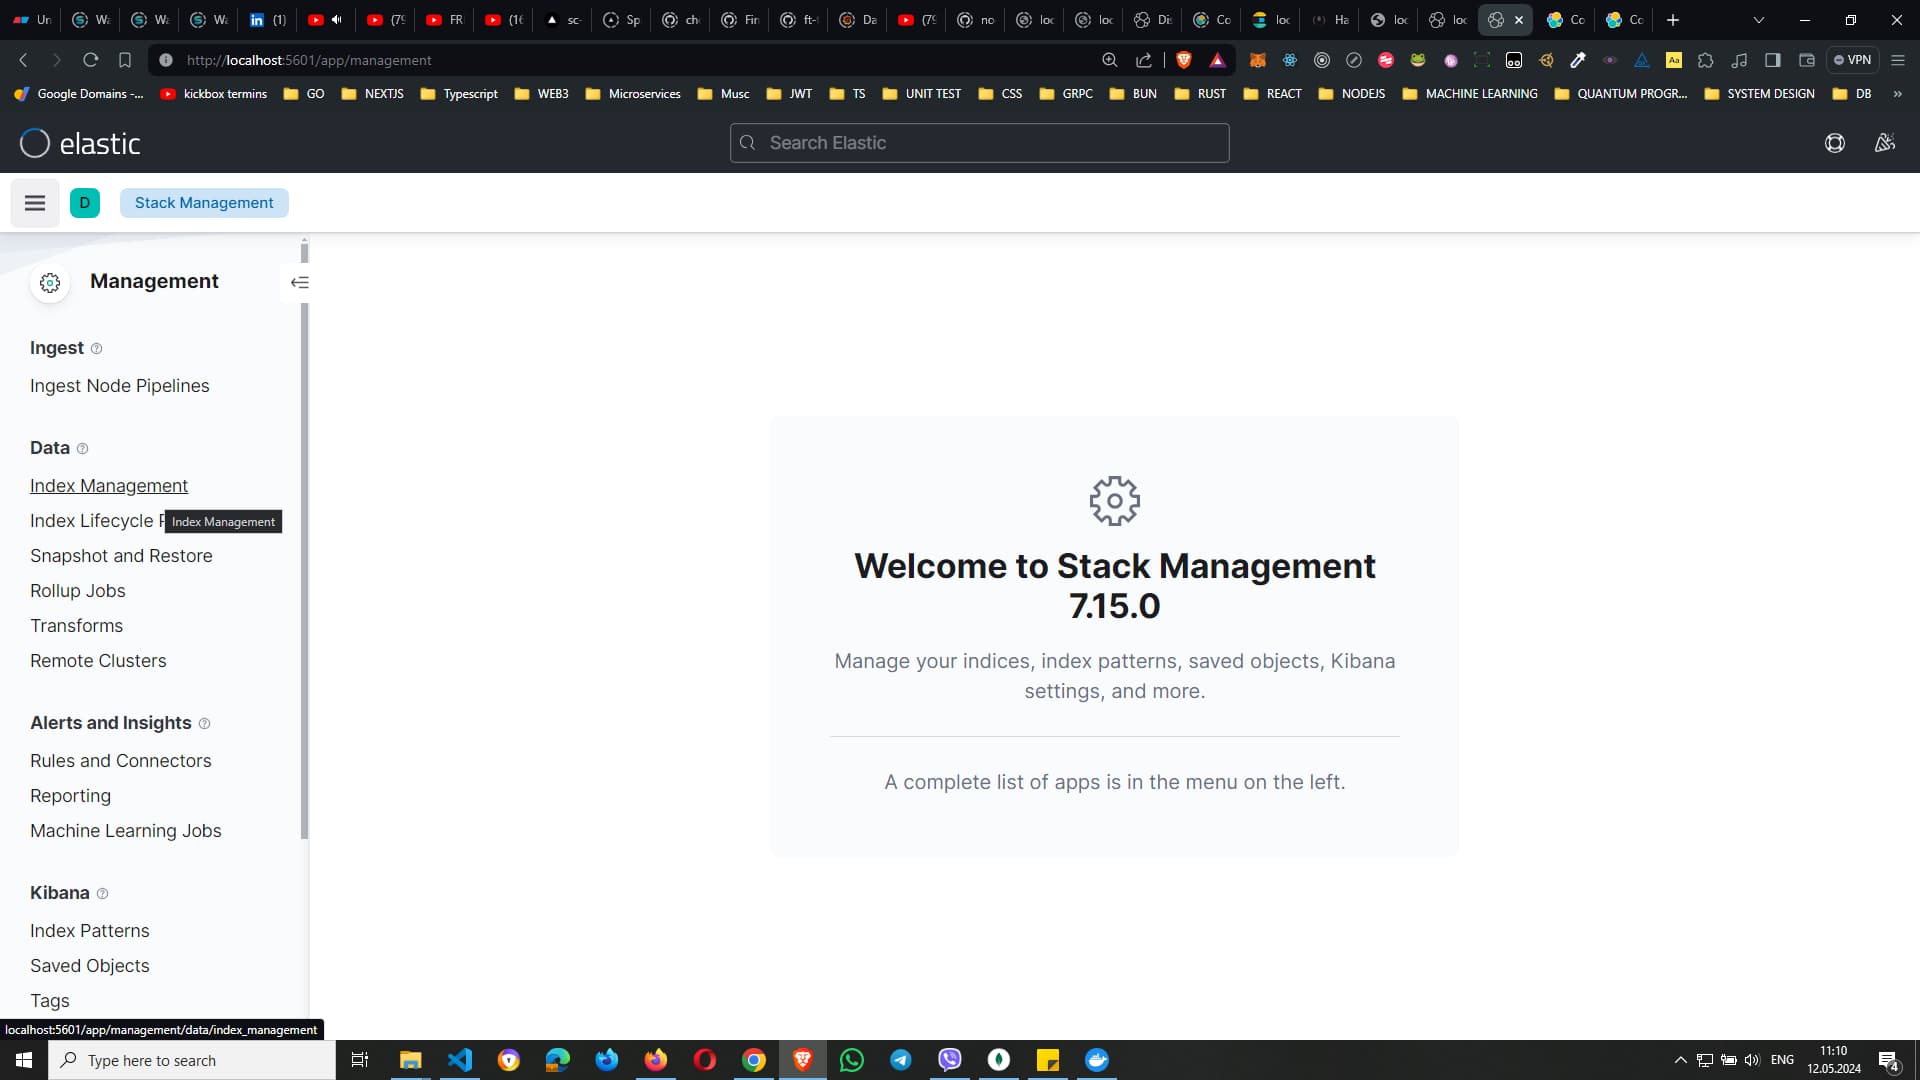
After that click on the 'index management' link:
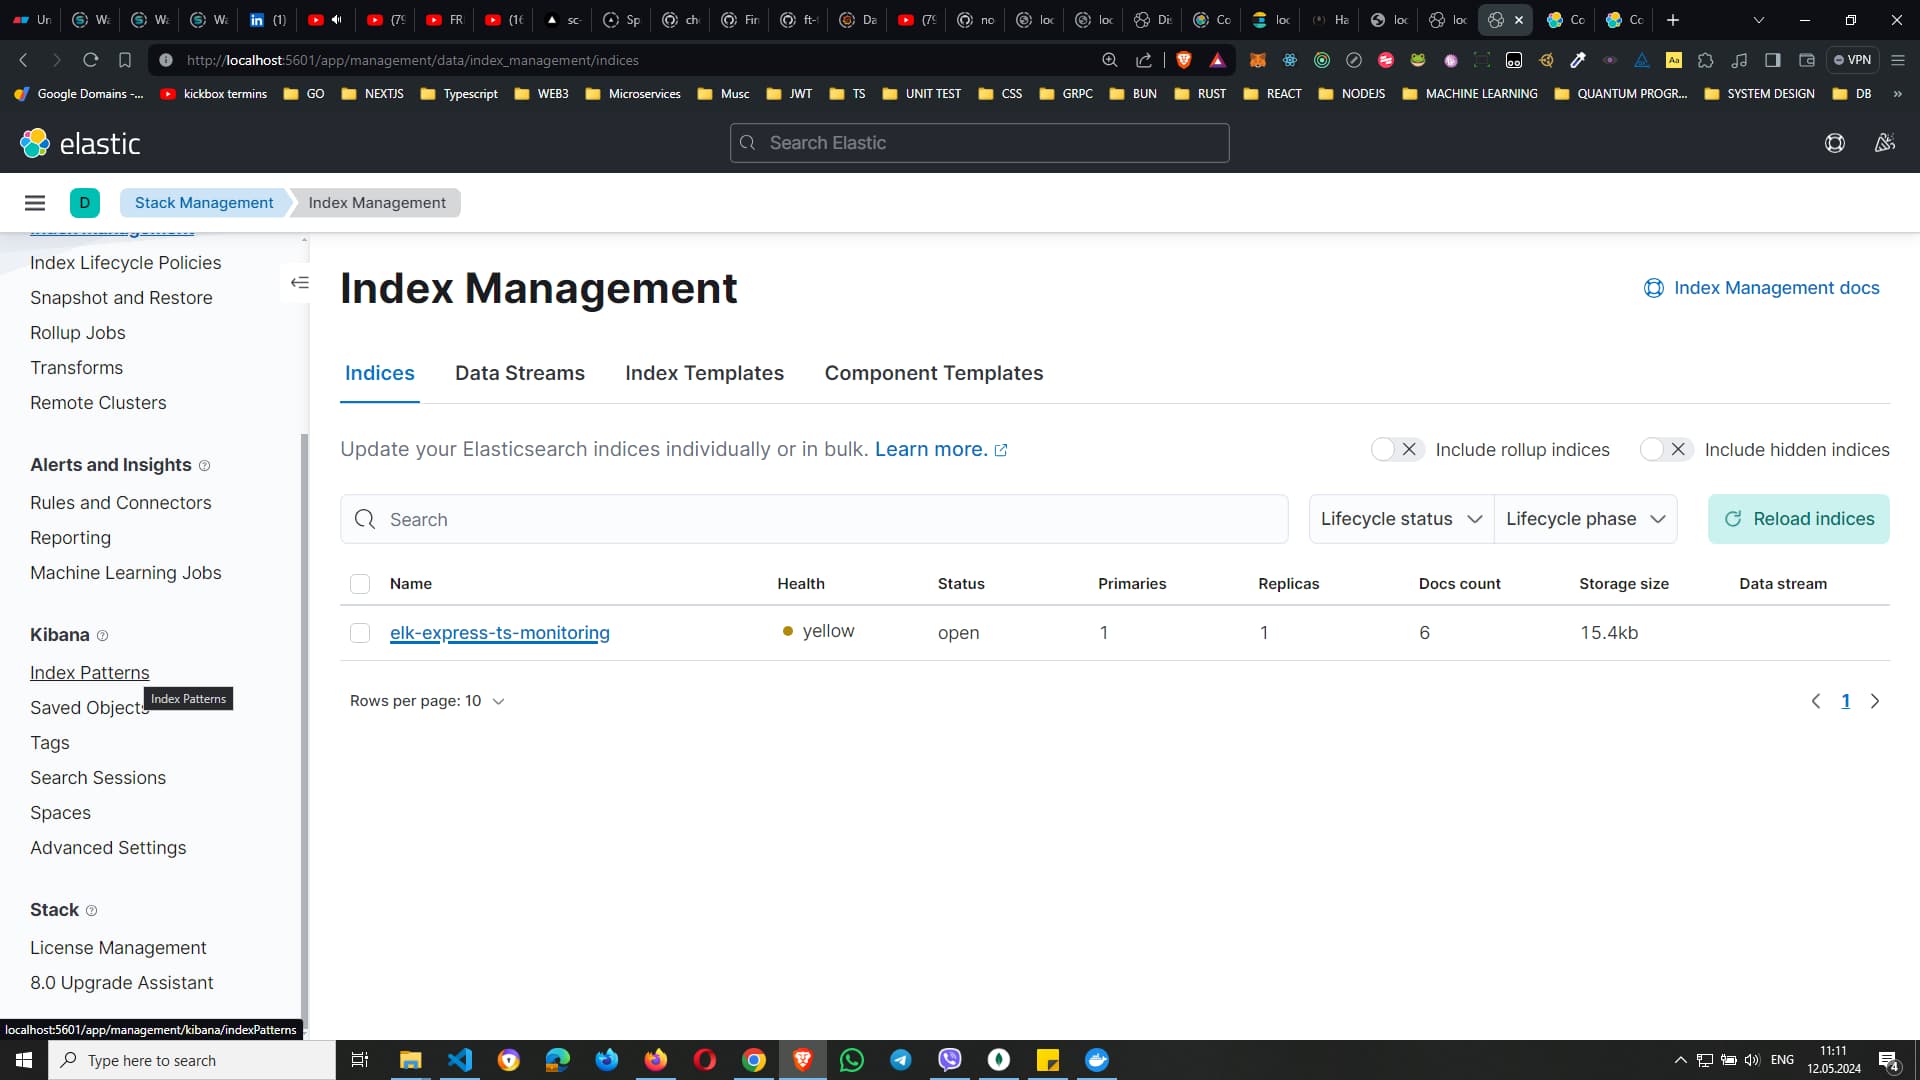
After that click on the 'Index Pattern'.
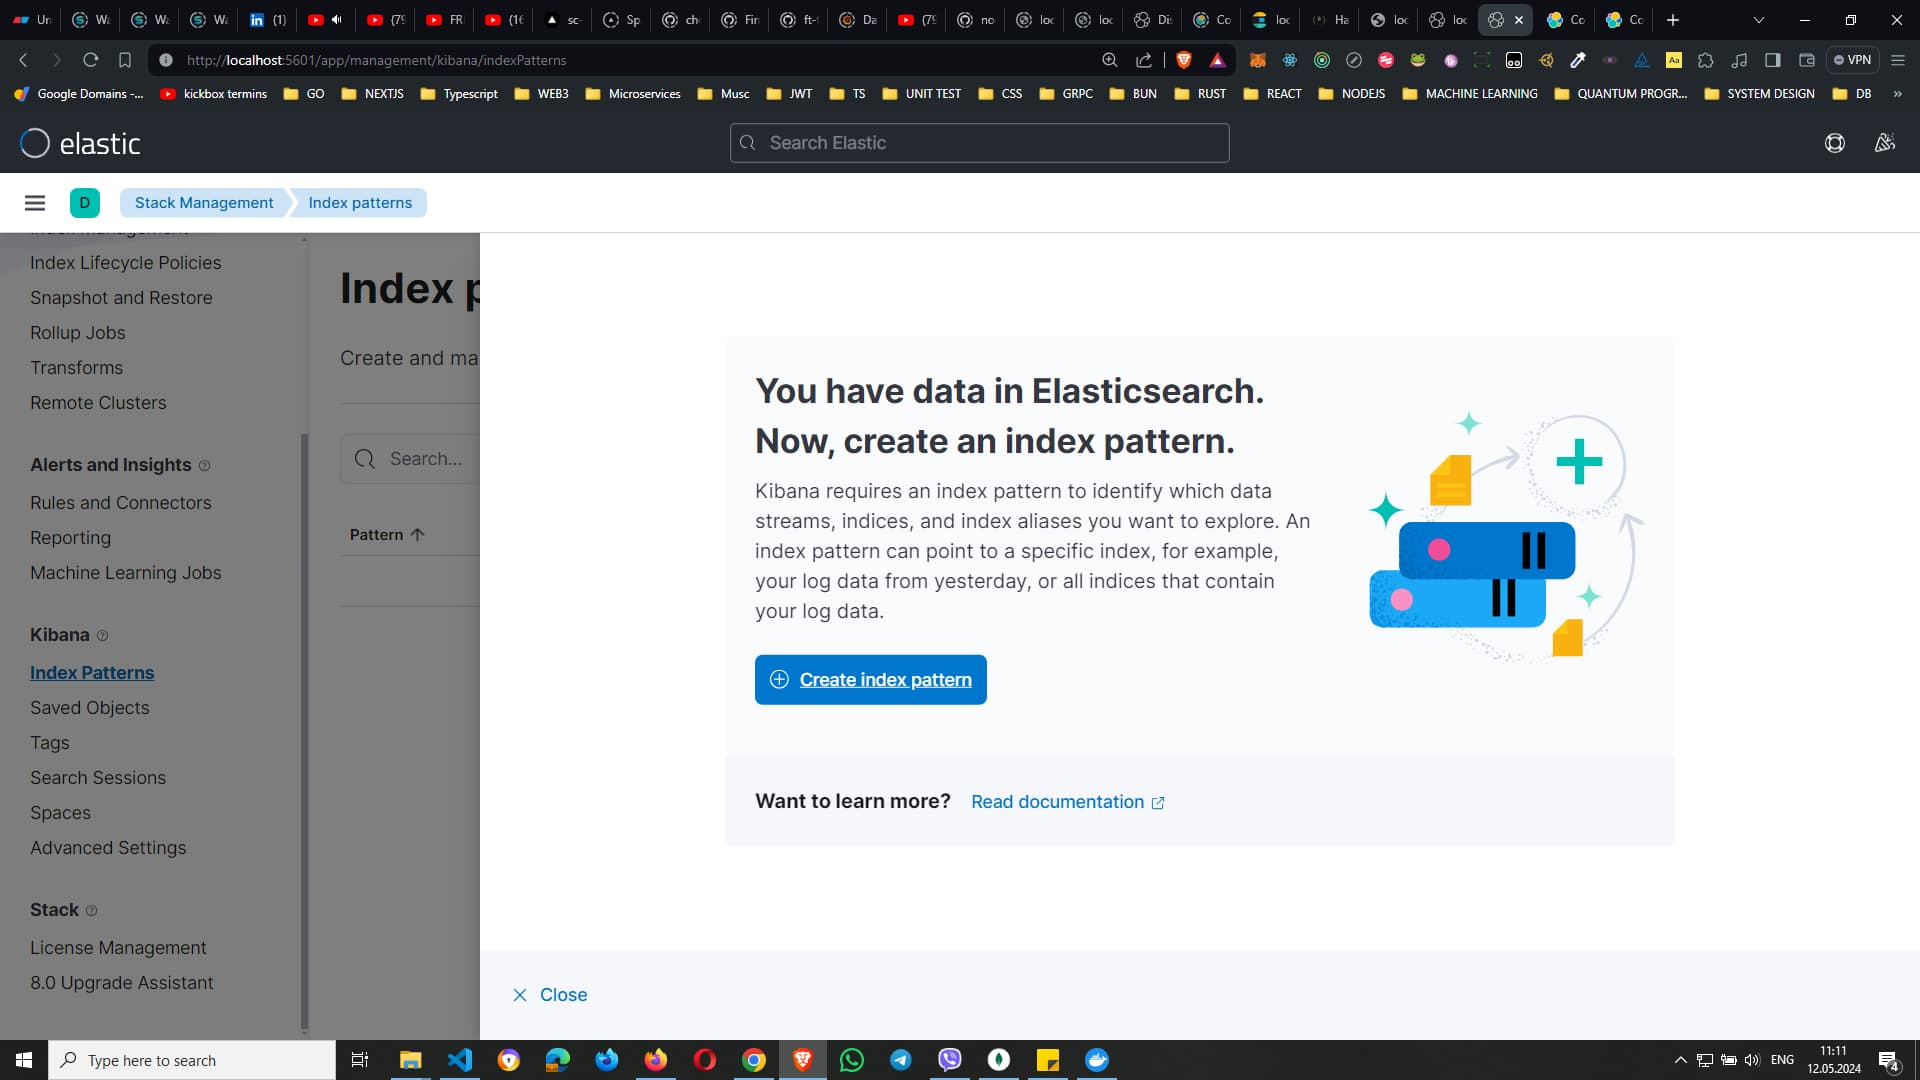
Next step is clicking on 'create index pattern' button
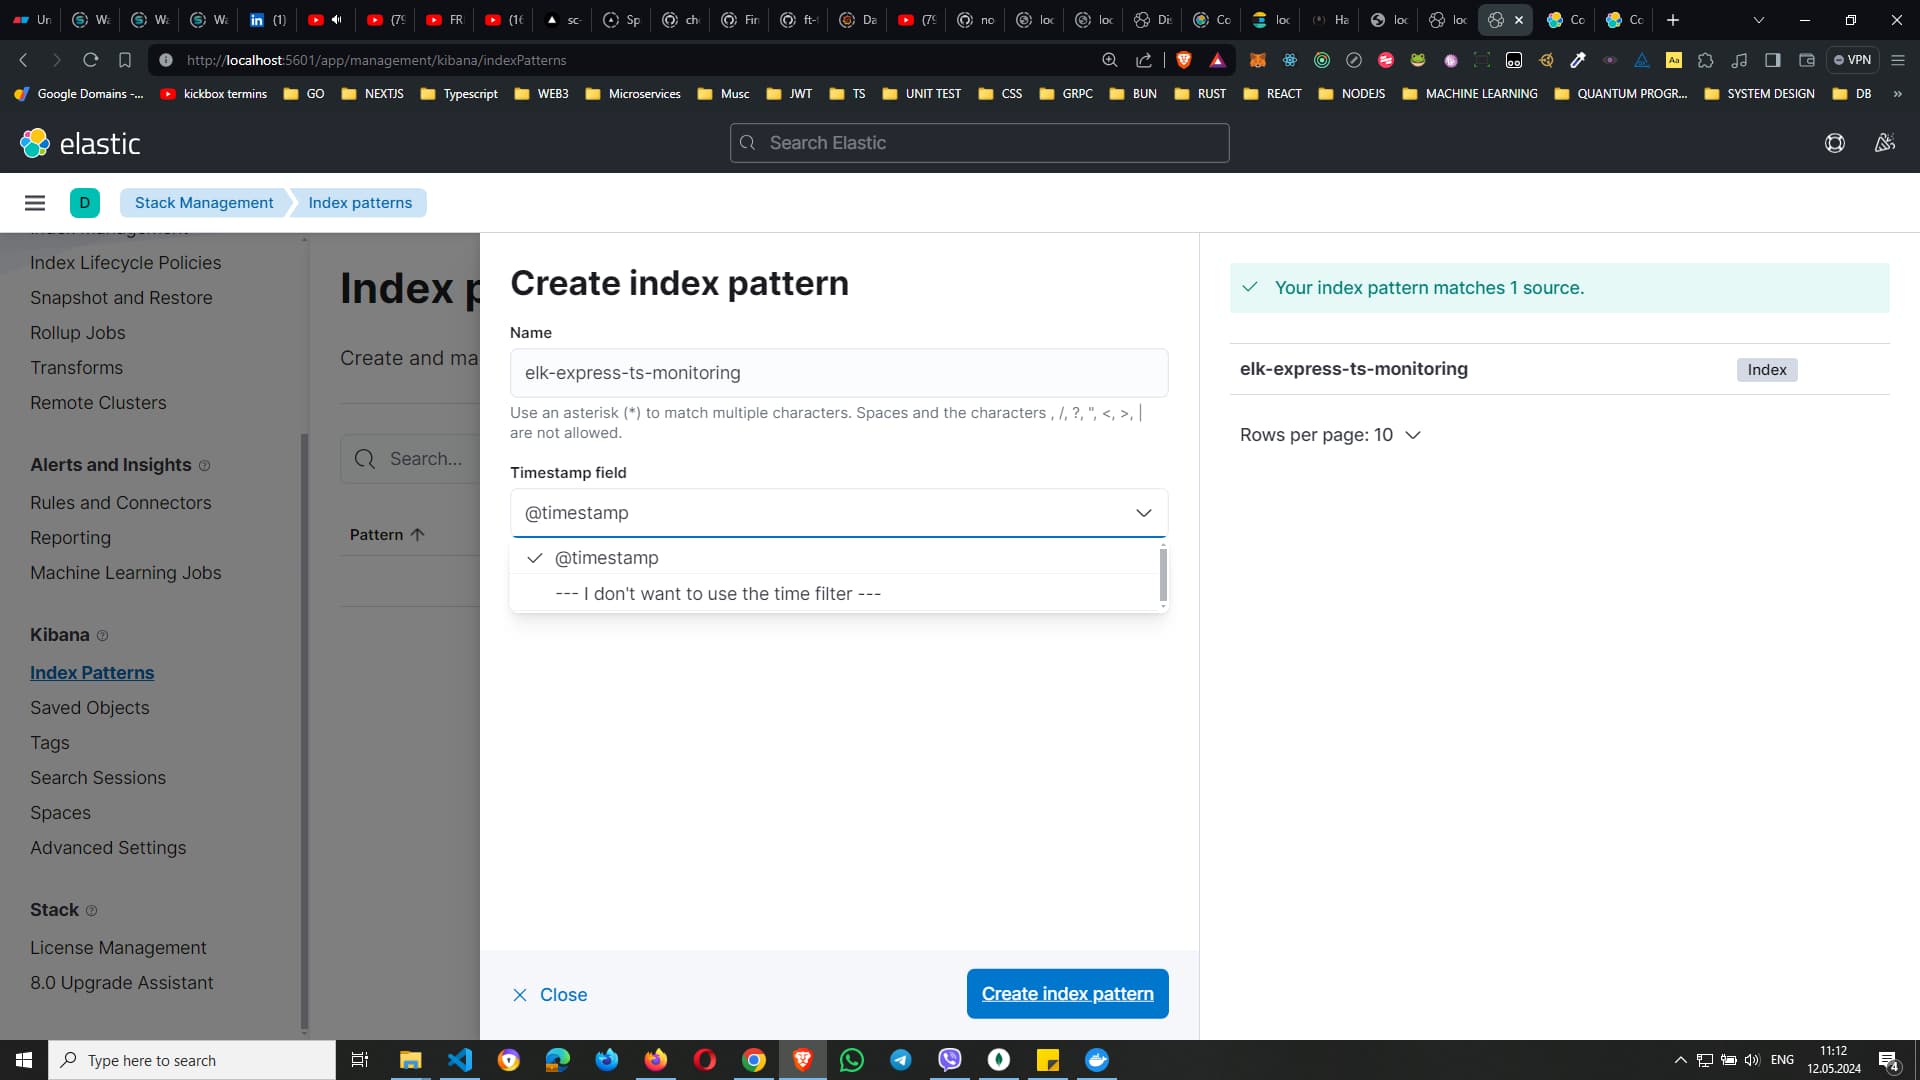
We should create a new index, in our case called: 'elk-express-ts-monitoring' and choosing 'timestamp' option and then click 'Create index pattern' button
On this screen again we have to click on the top left menu acordion, and then on 'Discover' link
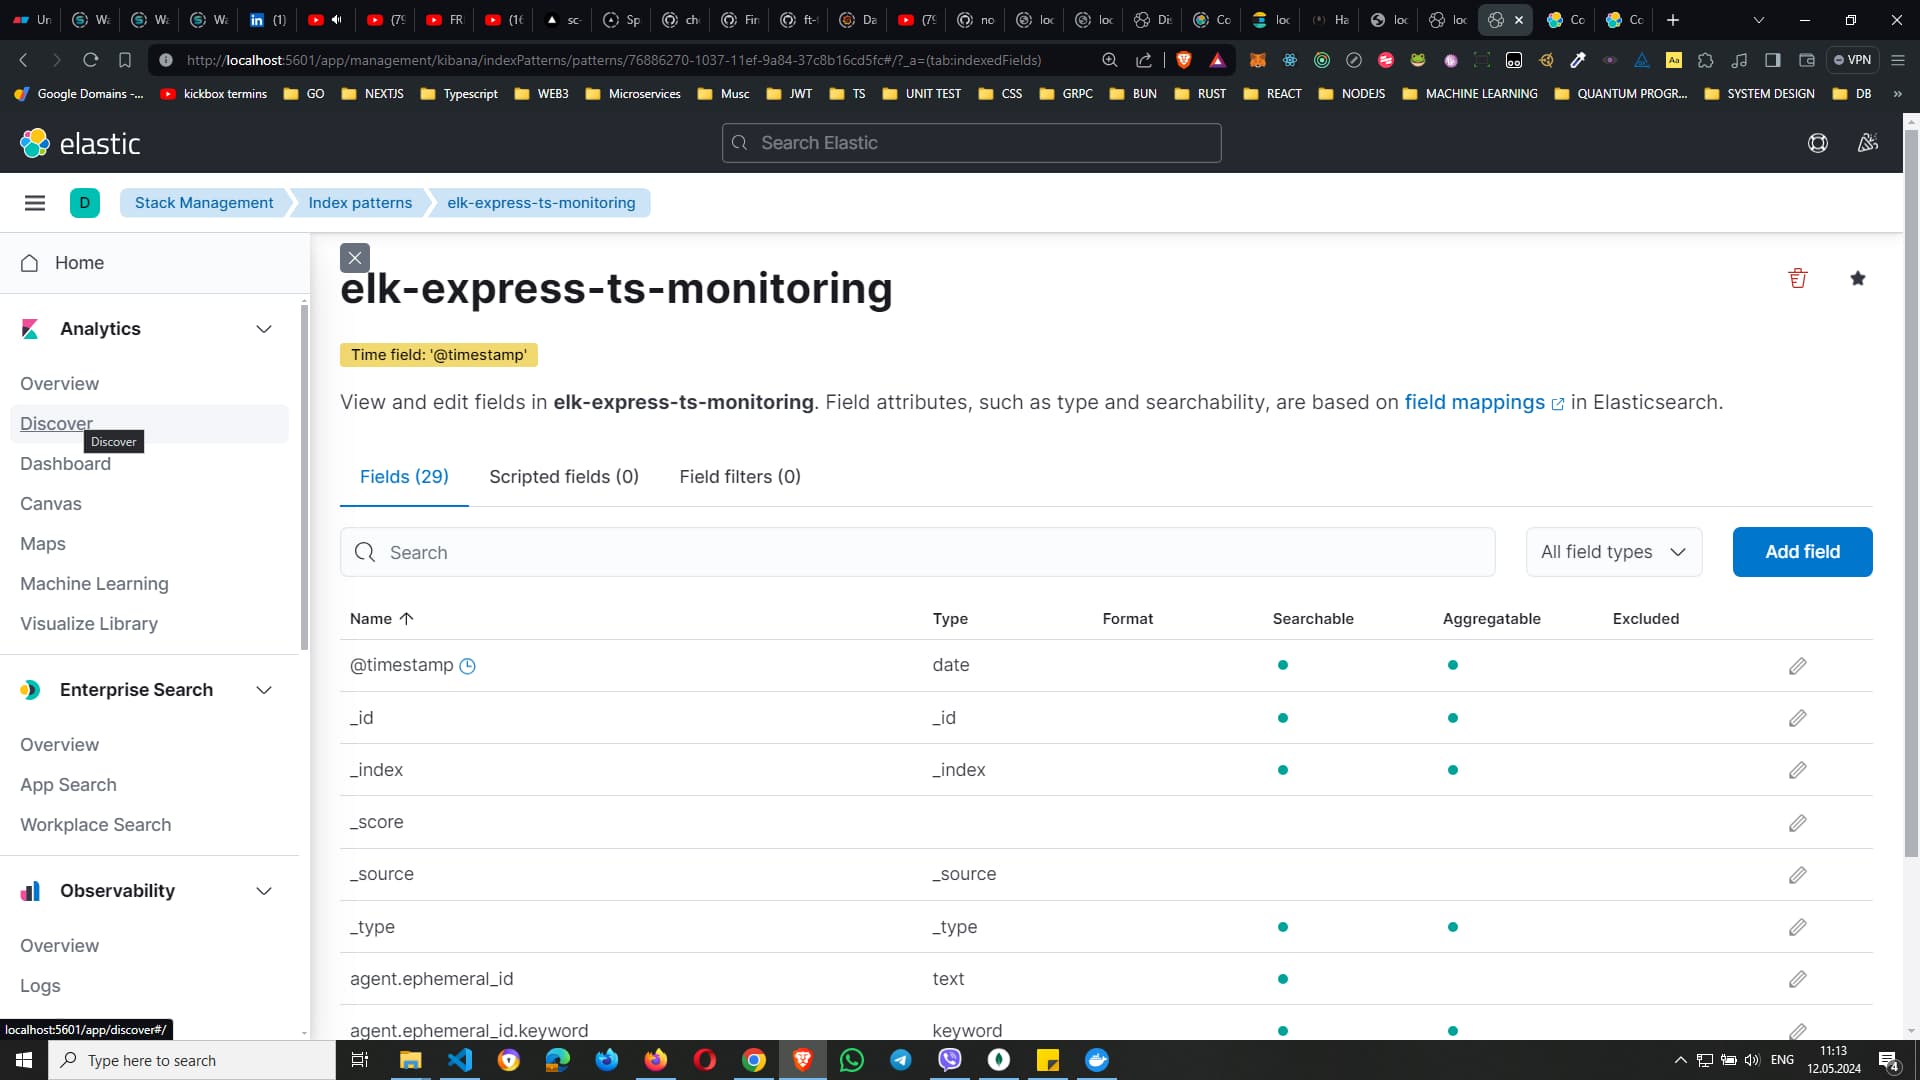
This sould be the next screen we should see:
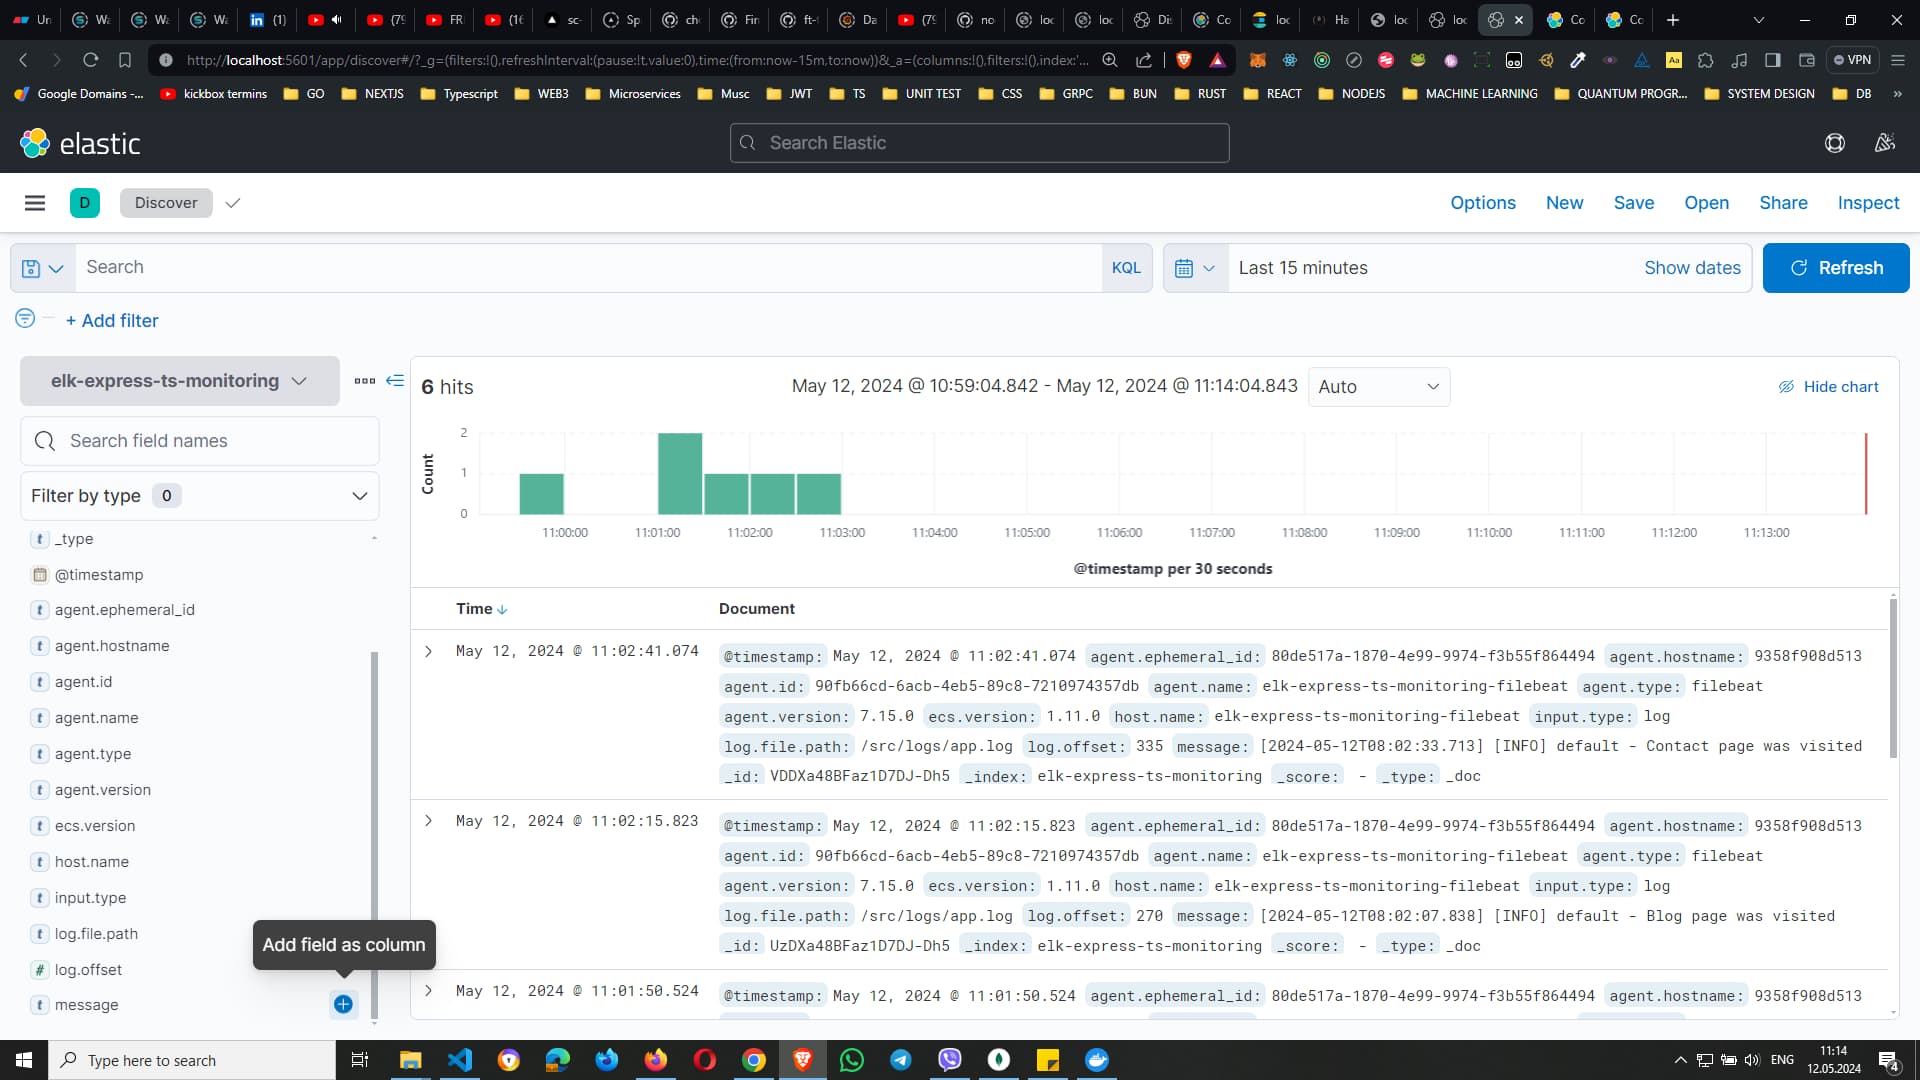
On the left menu, the link on the bottom - 'Message':
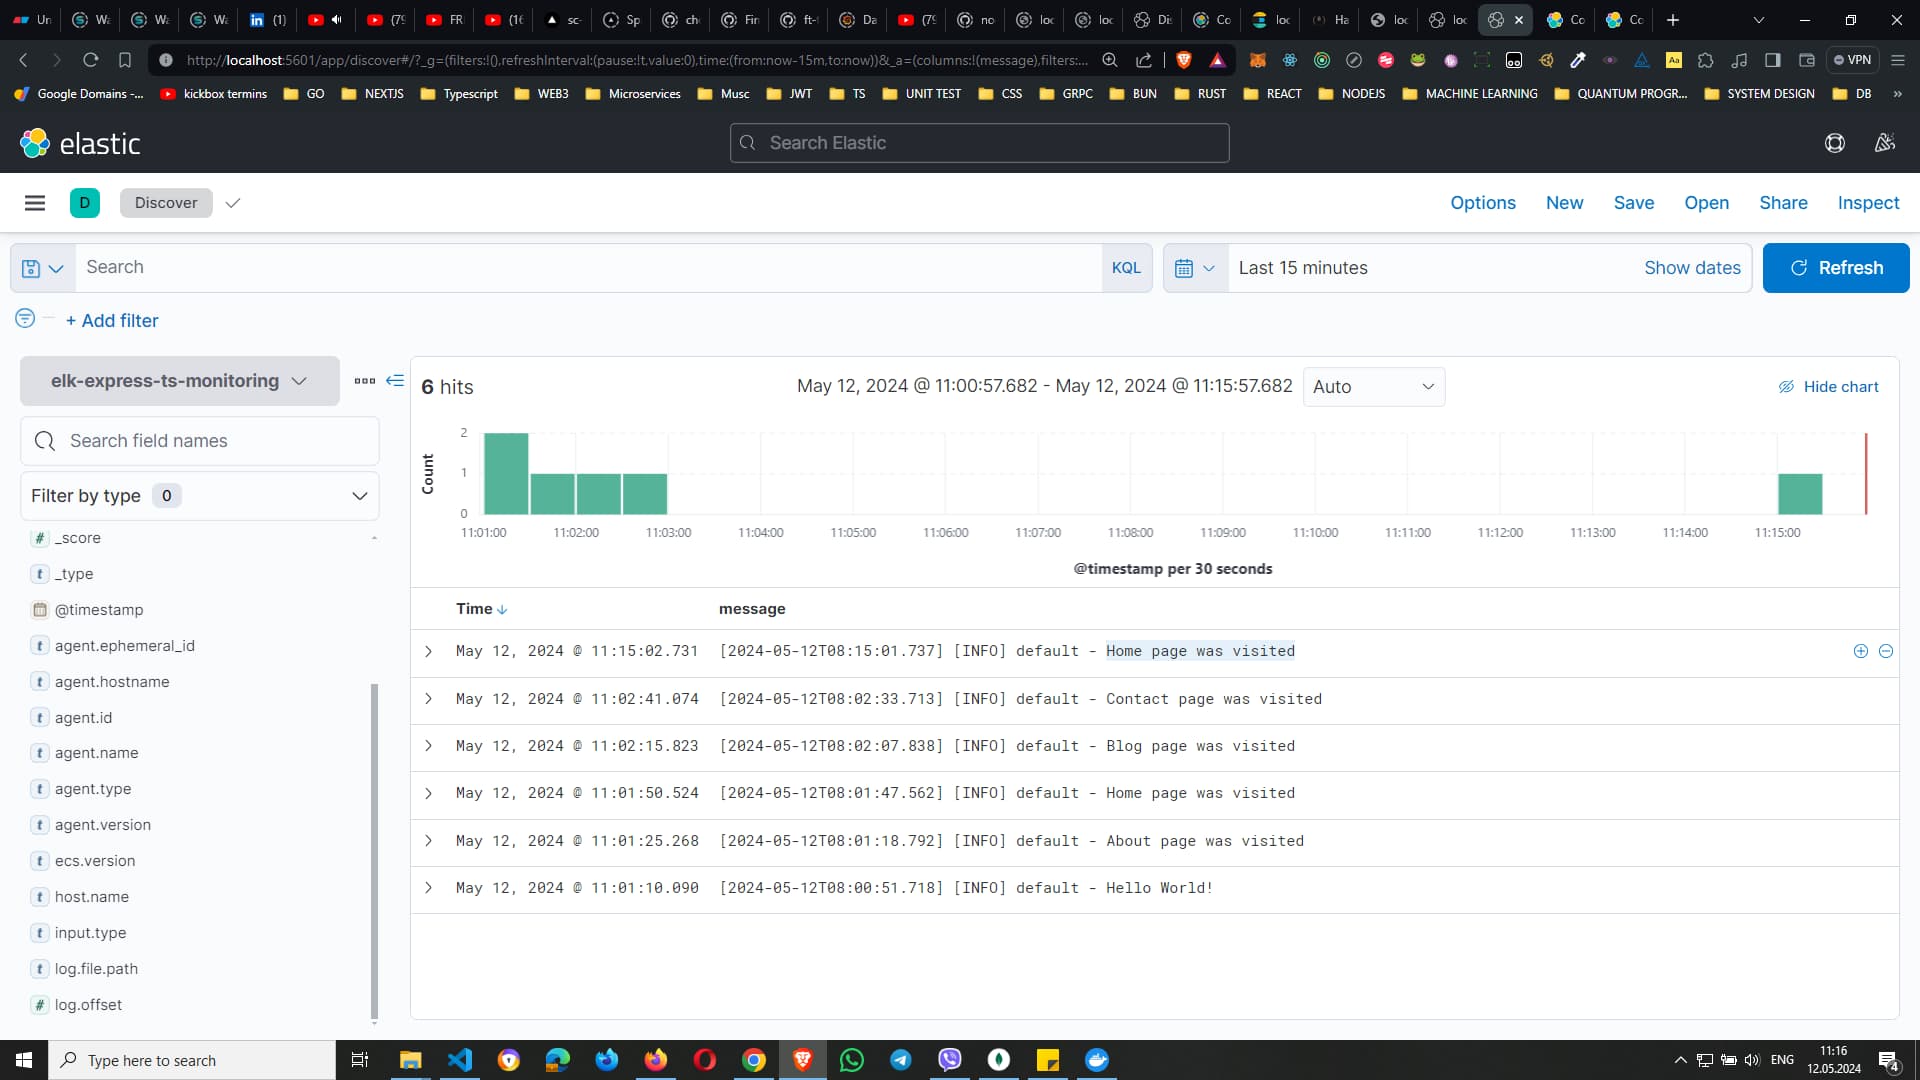
Right now we shoould see messages from all the visited pages in our application, and if we visit any of those pages again, we should receive new messages here again!
In our visual studio
This is the end of part 3 - the final part
Click here to continue to the part 1 | Click here to continue to the part 2
ELK Monitoring - https://github.com/cholakovit/elk-monitoring-tutorial